In Search of Premium to Book Value
So in the last post, we found that the deferred tax assets (unrealized capital gains on stock holdings) is deducted from BRK’s total shareholders’ equity and not from the insurance segment shareholders’ equity. So when figuring the total value of BRK, the deferred taxes can be added back.
Now we have to look at the other segments to see what the ROE’s of those segments are.
Manufacturing, Services and Retailing (MSR)
This segment includes all of the wholly owned operating businesses outside of railroads (Burlington Northern), Utilities and Energy (MidAmerican) and Finance/Financial Products (mobile home loans, derivatives etc…).
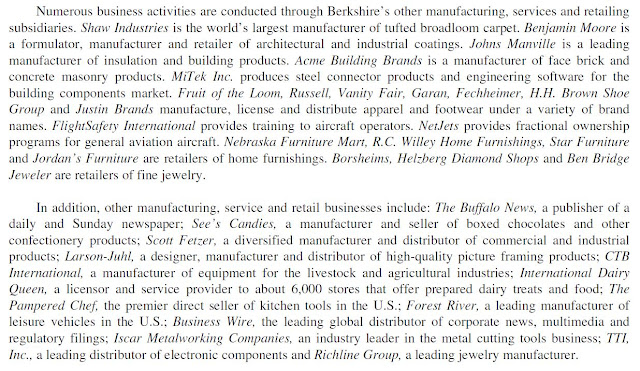
This includes the retailers like Nebraska Furniture Mart, See’s Candies, Dairy Queen, manufacturing like Marmon Group. OK, here’s a snip from the annual report:
There’s a lot of stuff in there.
But at the end of the day, what really matters? For his simple, base case analysis, ROE is what we want to know. What is the ROE of this segment? It’s nice to know that See’s Candies is an amazing company, and things like that, but let’s see how this group as a whole performs financially.
This segment is included in the “insurance and other” on the balance sheet of BRK. But further into the annual report, the balance sheet and revenues, pretax and net incomes are broken out.
Let’s see how this segment looks overall in 2010:
MSR Segment
Shareholders equity: $31.6 billion
Revenues: $66.6 billion
Pretax income: $4.3 billion
Net earnings: $2.5 billion
Segment pretax margin: 6.5%
Segment ROE: 7.9%
So this segment earns a 6.5% pretax margin and an ROE of 7.9%. What would you value a company that earns 7.9% ROE? I would typically *not* award that company with a P/B ratio of 1.0x. I would demand a discount to book such that the return to me would be 10%. Again, that is being conservative.
But after all this talk of how wonderful See’s Candies is and how many businesses are worth way more than book, how come this segment overall has only a single digit ROE? It is not so compelling.
It’s true that the housing sector is in a ‘depression’, so the earnings there and others are depressed. So just as a sanity check to see what the ROE might be in a more ‘normal’ environment, I went back to look at the ROE of this segment in the period 2005 to 2007. By any measure, those were great years, if not bubble years. When you look at most companies, you would expect their best performance in those years, especially ones that are dependent on the economy.
So here is the shareholders equity, net income and ROE of the MSR segment in those three years:
Equity Net income ROE
2005 $16.8 bn $1.6 bn 9.5%
2006 $22.7 bn $2.1 bn 9.3%
2007 $25.5 bn $2.4 bn 9.4%
So we see that even in the best of times, the segment earns a little less than 10% ROE. This is not bad, of course. But does the business/segment merit a valuation higher than book value?
The conservative side of me says no. Let’s be generous and assume that the segment ROE will eventually get back to close to 10% and give the segment a valuation of no more than book value.
On that basis, this segment is not a source of premium to book value of BRK as a whole.
Railroads, Utilities and Energy (RUE)
The other large segment is this one. I only break it down this way as this is the way it’s broken down in the annual report balance sheet. Railroads, of course, is Burlington Northern that BRK purchased recently, and utilities and energy is MidAmerican.
Both of these areas is highly regulated and capital intensive. They are businesses with decent returns on capital, but not great returns. Burlington Northern, for example, had a return on invested capital of around 10% or so before being acquired by BRK. Utilities also are highly regulated and won’t earn very high returns on capital, but they will earn decent returns.
The shareholders’ equity tied up in this segment is $69.6 billion versus a total net income of $3.6 billion for a segment ROE of 5.2%.
This is not that particularly high, of course, because of the Burlington Northern purchase.
Is this segment worth more than book value, the value it is held on BRK’s balance sheet? I may be missing something, but otherwise, an ROE of 5.2% doesn’t seem to me to merit a premium to book value. Using an annualized figure of the 9 months year-to-date figure doesn’t change it much. The equity in the RUE segment (which isn’t actually a single segment) was $71 billion at the end of September 2011 and the net income for the first nine months of the year was $3.0 billion. Annualizing that by multiplying by 4/3 gives an annualized net figure of $4 billion for an ROE of 5.6%, not much different than 2010.
So it may even be generous to give this segment a 1.0x book value ratio, but let’s leave it there. We can adjust down later. Let’s call the value of this segment $69.6 billion.
Finance/Financial Products
OK, this segment is a bit strange. This is where BRK’s odds and ends are put in, like the stock market index put options and credit default swaps. But the main business here is the mobile home loan business and maybe some other stuff. It looks like this segment earns around $440 million/year. Oddly, the derivatives mark-to-markets and oddball bets like that go in a separate p/l line while the assets/liabilities are actually booked in the segment.
So instead of looking at book value, I will just put a 10x multiple on the $440 million net earnings of this segment, which looks pretty stable for a value of $4.4 billion.
This ignores Buffett’s oddball bets here and there and puts zero value on those. Since it is not a major factor in the valuation of BRK, I think it’s OK to ignore those bets.
Putting it All Together
So let’s summarize what we just looked at.
Segment Value ROE
Insurance $96.4 bn 10.0% (pretax assuming 10% return on stocks)
MSR $31.6 bn 7.9% (after tax, in better times this can be closer to 10%)
RUE $69.6 bn 5.2% (after tax)
Finance $ 4.4 bn — (simply used 10x net earnings)
Total: $202 bn
With 1.65 million shares oustanding and with the above analysis, BRK stock is worth around $122,400/share.
The stated book value per share as of the end of 2010 is $95,453/share around so the above intrinsic value is around 1.28x stated book value per share. Much of that is due to the deferred tax asset that is deducted from BRK’s shareholders total equity but not from the insurance segment equity (as discussed in that section of my comments), and a little bump up due to my valuing the Finance/Financial Products segment at higher than stated book value. The stated book value is a strange thing as it includes marks as the assets and liabilities of derivatives are booked there.
With the above insurance segment ROE possibly being as low as 6.5% (after tax) and other low ROE segments, I’m sure many will assume this 1.28x stated book value valuation is high.
However, counter to that argument is that this doesn’t at all incorporate float growth which can allow BRK to grow without adding equity capital. This would be additive to the above ROE figures.
In any case, this is just another way to look at the valuation of BRK and I am comfortable that this level of $122,400/share or roughly 1.3x book is a good rough estimate of the intrinsic value of BRK.


I know that this is an old post, but I think you should look through this again. When you were looking at ROEs by segment, you included goodwill, which I would say should be excluded.
Just a quick example on my thought process:
Let's say you bought coke for $100B (admittedly ridiculous but bear with me). Earnings would be $9 billion and Coke's equity is around $34 billion. However, goodwill on Berkshire's balance sheet would be $66 billion. If you didn't exclude the goodwill, you would say that the ROE would be 9/100 or 9% and that Coke was worth around carrying value on Berkshire's books. In reality, it would be worth somewhere around $150-200B.
I think a good way to summarize it would be that if you buy a company that earns a good return on its tangible assets for a fair price (say 15x earnings), looking at ROE for the parent without taking out goodwill will undervalue the company, and the undervaluation will go up over time if the company increases its earnings.
That's a good point and good example. I used book value including goodwill because we tend to use book value including goodwill as a proxy for intrinsic value. If we used tangible book value per share as a proxy, then return on tangible book value would make sense.
So that was the argument. Your Coke example makes sense too. I guess the question becomes what multiple of earnings you want to put on the non insurance business.
So for me, I value Berkshire's companies individually then add the value of the stocks (I value things to a 10% return too, and I realize that valuing stocks at carrying value at that case will probably overstate their value, but I'm okay with that).
My value comes out to approximately:
Insurance underwriting profit – $1B, value of $10B
Insurance income on float/bond portfolio – $2.5B, value of $25B
BNSF earnings – $3.7B, value of $66.6B (PE of 18)
Utilities earnings – $1.5B, value of $16.5B (PE of 11)
Other business earnings – $4.1B, value of $70B (PE of 17)
Financial Products earnings – $670M, value of $8B (PE of 12)
Equities – $115B
These numbers are a guess of the yearend figures, but adding all of that up gets me to a value of around $320B, or $130 per share. I know we might disagree some on exact valuations, but I think taking another look at it shows that there's a lot of value around $110.
That's a good way to look at it. I've seen similar analysis and think it's a good way to look at it. In my posts before, I was just thinking through various ideas so I don't actually have just one way to look at BRK. I do look at what others do too and I don't really think one is right or wrong etc…
Thanks for reading.