So this annual report recently came in the mail. It’s another great read; a no-nonsense manager that has a great long term track record etc…
But then as I was reading this, I realized it sits on a common thread of this blog recently (inflation, too much debt, dollar destined to go down, manage capital accordingly etc…), so I figured I’d make a quick post about this company.
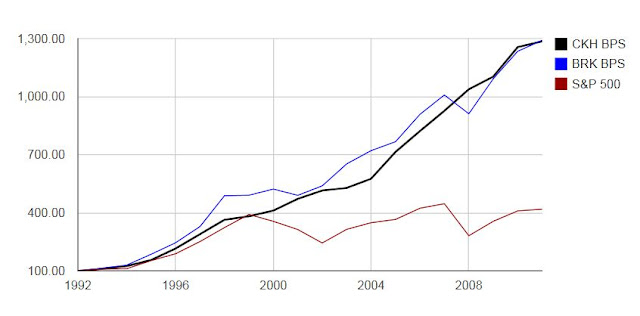
I noticed a similar pattern here with SEB (Seaboard) so I decided to do the same thing: compare CKH with Berkshire Hathaway (BRK) and the S&P 500 over various time periods:
So check this out. CKH book has grown very nicely and consistently since 1992 keeping pace with BRK and blowing away the S&P 500 index with dividends. I’m not picking on BRK, of course; it’s a great company. But it’s nice to compare capital allocation oriented managers with BRK since the S&P seems to be too low a hurdle (for some of these great managers). And guess what? CKH is not a financial stock!
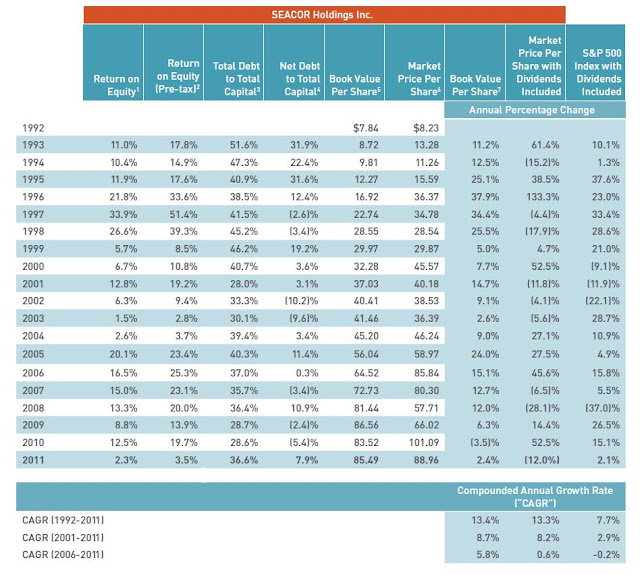
Here is the performance table from CKH’s 2011 annual report:
I love it when companies put the key performance figures in a clear table going all the way back like this. It makes it easy to see how the company has done over time right away. Of course, BRK and LUK do this and put it on their front page.
I do understand why most companies don’t do this (because it would just make them look bad!), but I wish they did anyway. It would save a lot of time so we don’t have to go digging into old 10-K’s to create our own tables.
Anyway, there are some points in the above table that may be misleading. First of all, in 2010, CKH paid a $15/share dividend so the BPS looks like it went down 5.4% in 2010. But that’s just because they paid a dividend. So the growth rates of book value per share is understated in the table. Note that Leucadia too left out a spinoff in their table so understates book value growth (the spin or distribution reduced book value).
Also, the stock price here is adjusted retroactively for the $15/share dividend so the annualized growth rates reflect the dividend (and real return to investor), but the relationship between the stock price and BPS will be off because of it so you can’t calculate the price-to-book ratio from the table (well, you can, but it will just be off a little).
So I adjusted for that in the below table that compares BPS growth for CKH, BRK and the S&P return:
CAGR Comparisons
Here are the comparisons (after adjusting CKH BPS growth for the $15 dividend) and with BRK added:
CKH BRK S&P 500 (w/dvd)
CAGR (1992 – 2011) +14.4% +14.4% +7.7%
CAGR (2001 – 2011) +10.5% +10.2% +2.9%
CAGR (2006 – 2011) +6.8% + 5.1% -0.2%
CKH has kept up with BRK in all of these time periods; 5 year, 10 year and 19 years.
Here are the averages for ROE and pretax ROE (from the table in the annual report):
Pretax
ROE ROE P/B ratio
Since 1993: 12.6% 18.8% 1.33x
Ten year average: 9.9% 14.5% 1.13x
Five year average: 10.4% 16.0% 1.05x
So from the above, we see that CKH has earned an ROE of 10-12% over time and a pretax return of 15%-19%. The P/B ratio is something I calculated by using stock prices adjusted for the split but NOT for the $15 dividend.
If the folks at Leucadia want to earn 15% pretax returns, then CKH at book value is a good buy for them, and if Buffett wants a 10% pretax return, then he can like CKH even at 1.5x book. (Not that they will; I am just using some of their recent comments as valuation benchmarks, that’s all…)
BPS at the end of March 2012 was $87.14/share, and the stock is trading at $86.75/share, just around book value. So at this price, it should be interesting to LUK, and Buffett would be interested in this even up to $130/share (1.5x book for a 10% pretax return).
(This may not be a type of business that Buffett would be interested in, though… )
OK, So Who and What is Seacor Holdings?
CKH is involved in offshore marine services, aviation services, inland river services, marine transportation services, emergency and crisis services, commodity trading and logistics, and harbor and offshore towing services. The big businesses are the first three.
Offshore marine serves oil and gas drillers, primarily in the gulf of Mexico and increasingly internationally. Aviation services also serves the oil and gas drillers, and inland river services is the barge cargo business in the U.S.
The last couple of years have been horrible for CKH as drilling in the gulf came to a halt after the BP disaster. CKH booked some profits helping to clean up the mess, but business went down a lot in 2011 due to that.
Business is apparently finally starting to turn since the fourth quarter of 2011.
Charles Fabrikant
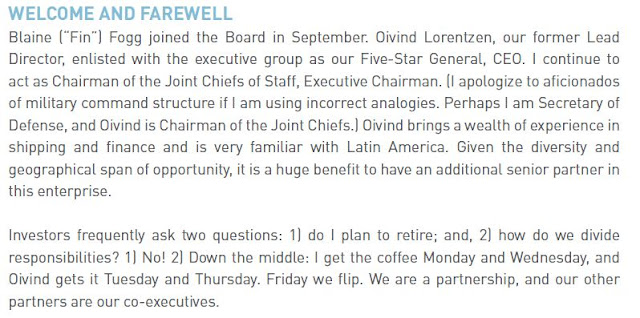
Fabrikant is the guy behind CKH which he founded back in 1990. He is a no nonsense guy that clearly says that he is in the business of buying and selling assets. He is no longer the CEO (gave up the post in 2010) but is the Chairman and wrote the 2011 Letter to Shareholders.
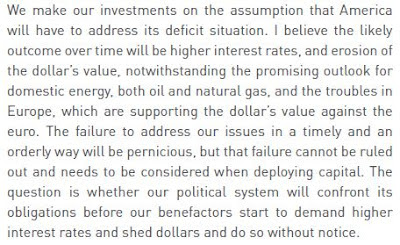
In the 2010 annual report, he wrote:
Anyway, to get a feel for Fabrikant, I would recommend reading all the letters to shareholders going back ten years (or whatever is available at the website). In fact, I would recommend people do that with any stock they buy; I bet people would tend to do better that way! (I don’t always do it either…)
In fact, if they made that into a law; that you can’t buy a stock unless you’ve read all the annual reports for the past ten years, it would really cut back on a lot of waste (lawsuits etc…). Of course, people would then complain that they wouldn’t have time to trade so many stocks and react to every earnings announcement, economic data release, headline, fad etc… Hmmm…
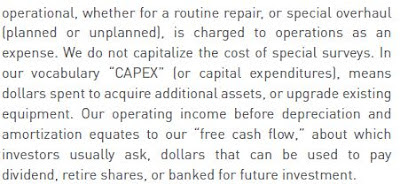
OIBDA *is* Free Cash Flow
At CKH, Fabrikant insists that operating income before depreciation and amortization is free cash flow. He has said this before, but here it is in the 2011 annual report:
So then let’s use OIBDA and cash earnings with Leucadia’s 15% and Buffett’s 10% return hurdles and see what values we can get.
First, here are the OIBDA and “Cash Earned” for the last five years from the annual report. From the ROE and pretax ROE table above, we see that the five year average is not so far off from the ten and nineteen year average so a five year average should be a good ‘normalization’ of OIBDA and cash earnings (even though 2011 was a horrible year due to the GOM situation).
Cash Pretax
OIBDA Earned Cash earned
2007 502 505 519
2008 499 411 486
2009 392 367 386
2010 572 398 549
2011 280 191 219
average: $449 mn $374 mn $431 mn
Total debt was $1.04 billion and cash and near cash assets were $816 million for net debt of $226 million. One can argue if all the cash can offset the debt etc… But let’s just keep it simple and see what happens here. It looks like net debt over the past few years have been pretty small.
So using the OIBDA, since this is before interest expense, we have to use enterprise value. If we want a 15% pretax return, then CKH would be worth $449 million / 15% – $226 million. That’s $2.8 billion. With around 21.1 million shares outstanding, that’s $133/share against the current stock price of $87/share.
If your pretax return hurdle is 10%, then CKH can be worth $202/share.
“Cash earned” is after net interest expense and taxes, so we can just look at this versus equity. So if your return hurdle is 10% after tax, that’s $374 million / 10% / 21.1 million shares = $177/share.
Just to keep it apples to apples, I added taxes back to “Cash earned” to make it a pretax figure (the difference between this and OIBDA, of course, is that it’s after other income/expense (interest), equity in equity method holdings and less minority interest).
So the pretax “cash earned” is $431 million.
The value per share of CKH at the 10% and 15% pretax return hurdles are:
CKH Value per share
Value at 10% pretax return: $204/share
Value at 15% pretax return: $136/share
Both of these are quite a bit higher than the current stock price in the mid-80s.
Having said all that, we have to keep in mind that whatever we think of this stock, CKH has tended to trade at around book value per share.
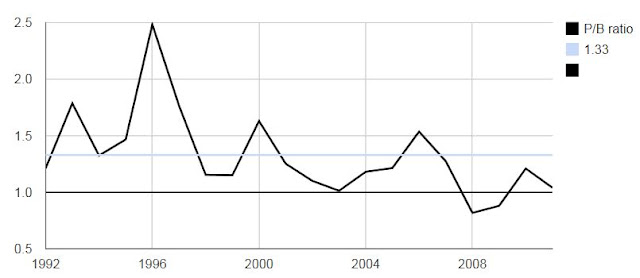
Since 1992, the P/B ratio has averaged 1.33x, but in the most recent five to ten years or so, it seems to have average more like 1.1x.
Credit Rating Downgrades
CKH’s credit has been downgraded by S&P from BBB- to BB+, but Fabrikant explains how CKH is actually in better shape now than in previous years. He explains it pretty well in the LTS, with a final thought on the subject,
“It was disheartening [and galling] to have our rating lowered, but if Uncle Sam’s printing press doesn’t support a Triple A rating, who am I to sulk?”
The Seacor Attitude
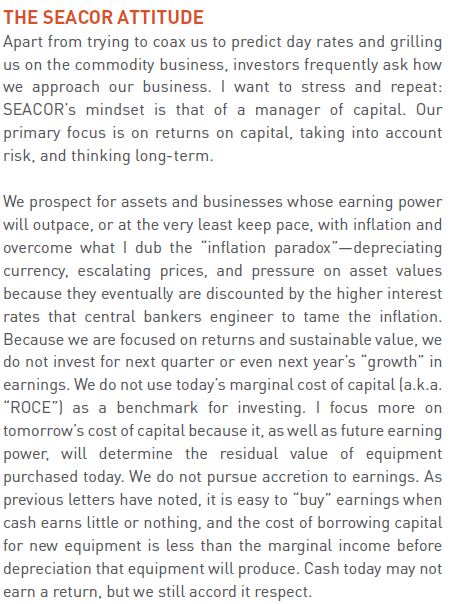
To really understand the mindset of CKH, there is a very good section at the end of the 2011 Letter to Shareholders that describes exactly what they hope to achieve.
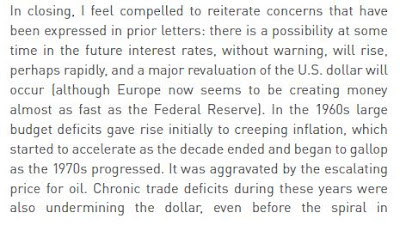
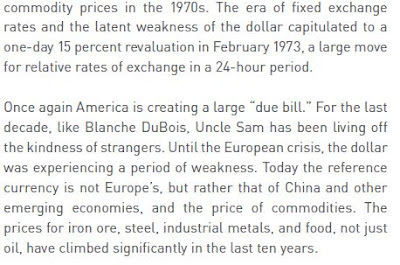
Here are some ‘snips’:
And finally, to tie it into the strategy being implemented at CKH:
Again, I am no big fan of theme investing or economic forecasting. But like Steinberg said recently, when you have the wind at your back, that’s good. This is the kind of business you like to be in.
And CKH seems to sort of fit that bill too.
Anyway, as usual, I do own some of this and the annual report just happened to land on my desk; I read it and thought it fit the recent ‘thread’ on this blog so I wrote it up.
If you read this post, buy the stock and lose money, too bad. This is not a stock recommendation!



Blog is fantastic…thanks for the work. Do you have "professional" experience or just enjoy the pursuit of "compounding machines?"
Thanks for the comment. Yes, I used to work on the street for many years in various capacities. I like compounding machines too; they are not mutually exclusive. 😉
What do you do now?
good work. thanks for posting to the web.
This is old news. Grants Interest Rate Observer was on this quite a while ago….
Thanks for the post. Yes, these guys have been around for quite a while. I don't think I'm going to be the first in mentioning these names. L, BRK, LUK, GLRE, GS, BH and others I mention around here also aren't necessarily new or undiscovered. It would be nice to find something totally undiscovered of such quality.
Anyway, if I have something interesting to say I will post about it and not worry too much about if someone already wrote about it before. I am not competing in a I-found-it-first contest. A good story is a good story as far as I'm concerned…
Great analysis!
I used to own the stock too (suggestion of 'Grant's) but sold it as it seemed like most of their income was coming from selling operating assets, so they were kind of liquidating the company. As an operating company it wasn't so impressive. (Late comment as I only just found your blog).
Good thoughts as always, so thx for all the insights… CKH has been on my radar recently (cant remember where from) and i'm getting more interested given the earnings release today and where the shares may price tmrw… One thing that bothers me a little is why other value funds are not involved in CKH. May be just bc of its size, but they aren't a new company so you'd think some of the "name brand" value guys have looked at this and found a reason to deploy into something else… Unsure if you receive emails from updates on old posts. Thx again for the blog postings.
Thanks for the comment. Yes, I do get updates on comments. As for why name brand value guys aren't in this name, I think it's due to size. At $1.4 billion market cap, it's just way too small for most big funds. It's easier to hold a bunch of JNJ or something like that.
Thanks for reading.
Looks like Third Avenue actually has a 587,614 position. http://www.streetinsider.com/holdings.php?q=CKH
This is an old post but I found it really useful thanks! I am considering Seacor for investment given the valuation now looks pretty compelling. ROEs look to be at their lowest for some time. Do you have any new thoughts on this? Big fan of the blog. Thanks, Tom.
Hi, It's run by great people and all, but as they say in their annual reports in recent years, there is just no end in sight of how bad things look. The industry is just in terrible shape and there's no way to know when things will turn. All I can say is that these big commodity trends tend to be really, really long. Look what happened after the early 1980's, for example, in crude. I don't think drill counts went up for years after that and this cycle may be a long one too as the amount of investments that went into energy/commodities in the past decade is just staggering.
So in that sense, it's a tough call.