The 2014 JPM annual report was finally released last week and it’s a great read as usual. Dimon takes his time to talk about the goods and the bads, industry trends, competitive threats and all kinds of things. It’s one of those letters (like Buffett’s) that you learn about all sorts of things reading it, not just about the company.
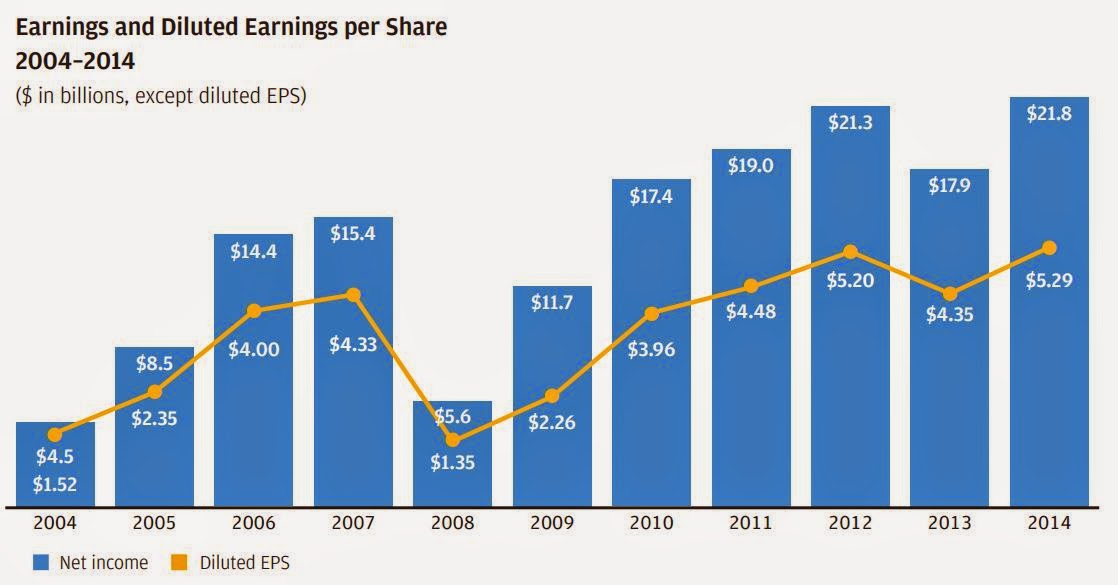
Anyway, here are the usual charts showing JPM’s performance in the recent past. Nothing new here, of course.
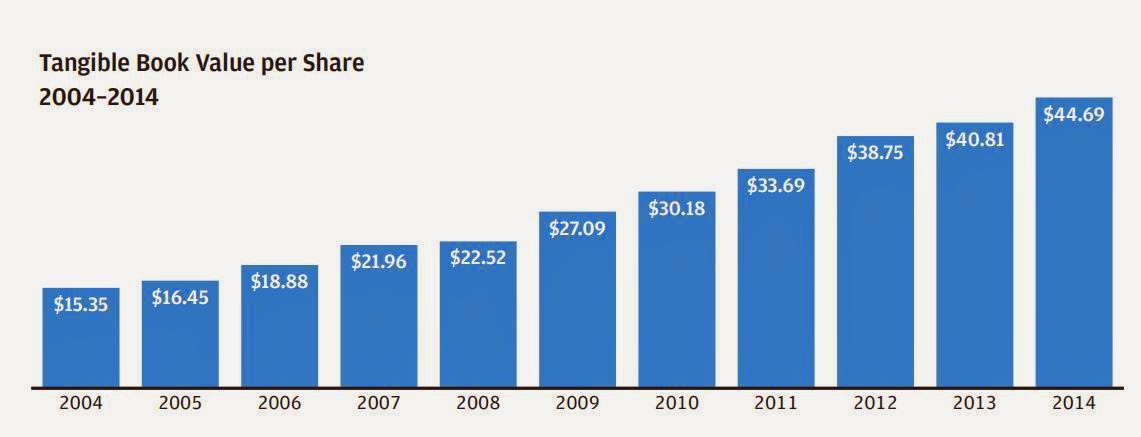
And my favorite chart is the tangible BPS growth over the past ten years:
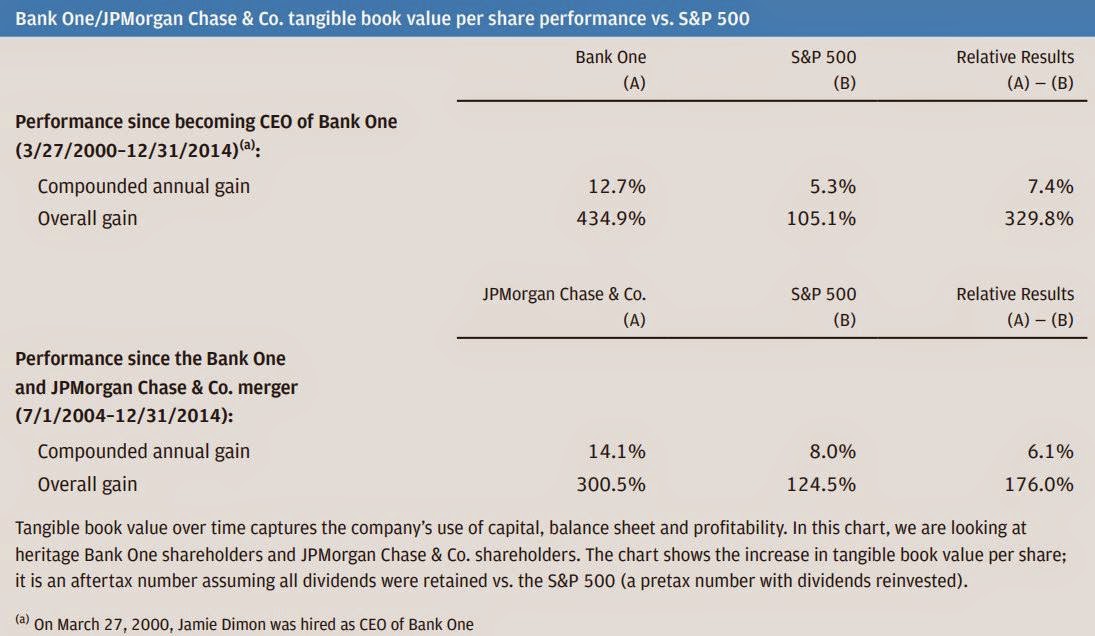
And here are some long term performance metrics that show how Dimon has performed as a CEO:
These are pretty impressive figures. For reference, since the end of 1999 (close enough to 3/27/2000!), BRK and MKL grew BPS at 9.4% and 14.8% respectively. Dimon grew tangible BPS 12.7%/year from March 2000. And this is a regulated bank that went through the financial crisis. Yes, it’s tangible BPS versus regular BPS for MKL and BRK. But still, it’s impressive.
Since the merger, Dimon grew tangible BPS at a rate of 14.1%/year. Again, this is not a perfect comparison but BRK and MKL grew BPS at a rate of 10.1%/year and 12.5%/year. BRK and MKL are 10 years through December 2014, and both are BPS, not tangible BPS. Again, keep in mind that the merger happened in 2004 so this period includes the financial crisis. It’s crazy when you think about how well JPM has done.
Stock Total Return
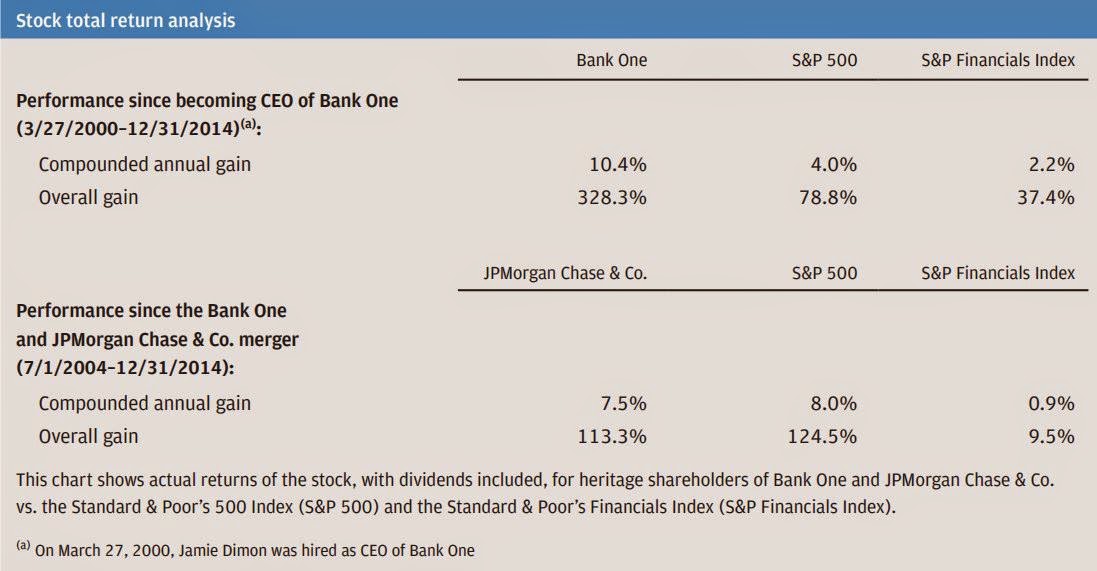
Of course, what really matters, though, is total return to the shareholders. And here too, JPM has done really well over the long term.
Better than BRK?!
I actually didn’t know this until I just calculated it, but if you owned Bank One when Dimon became the CEO and held your shares through the merger and through December 2014, you would have done better than owning BRK over that time period.
Bank One/JPM had a total return of 10.4%/year during the period 3/27/2000 – 12/31/2014, and BRK shares returned +8.7%/year during that time. That’s kind of nuts when you think about it. Bank One was a boring bank. And JPM was a leveraged, risky house of cards; an almost-certainly-the-first-to-fall-in-any-financial-crisis money center bank. And it has done better than BRK over the past 14 years?
And you don’t even have to look at the comparison with the S&P Financials index. A more direct comp would be Citigroup and Bank of America, but we don’t even need to get data to see that JPM did better.
Dimon does note, though, that the stock has not done well recently:
However, our stock performance has not been particularly good in the last five years.
While the business franchise has become stronger, I believe that legal and regulatory
costs and future uncertainty regarding legal and regulatory costs have hurt our
company and the value of our stock and have led to a price/earnings ratio lower
than some of our competitors. We are determined to limit (we can never completely
eliminate them) our legal costs over time, and as we do, we expect that the strength
and quality of the underlying business will shine through.
He says that the legal costs should normalize by 2016 implying that the uncertainty discount may go away around then.
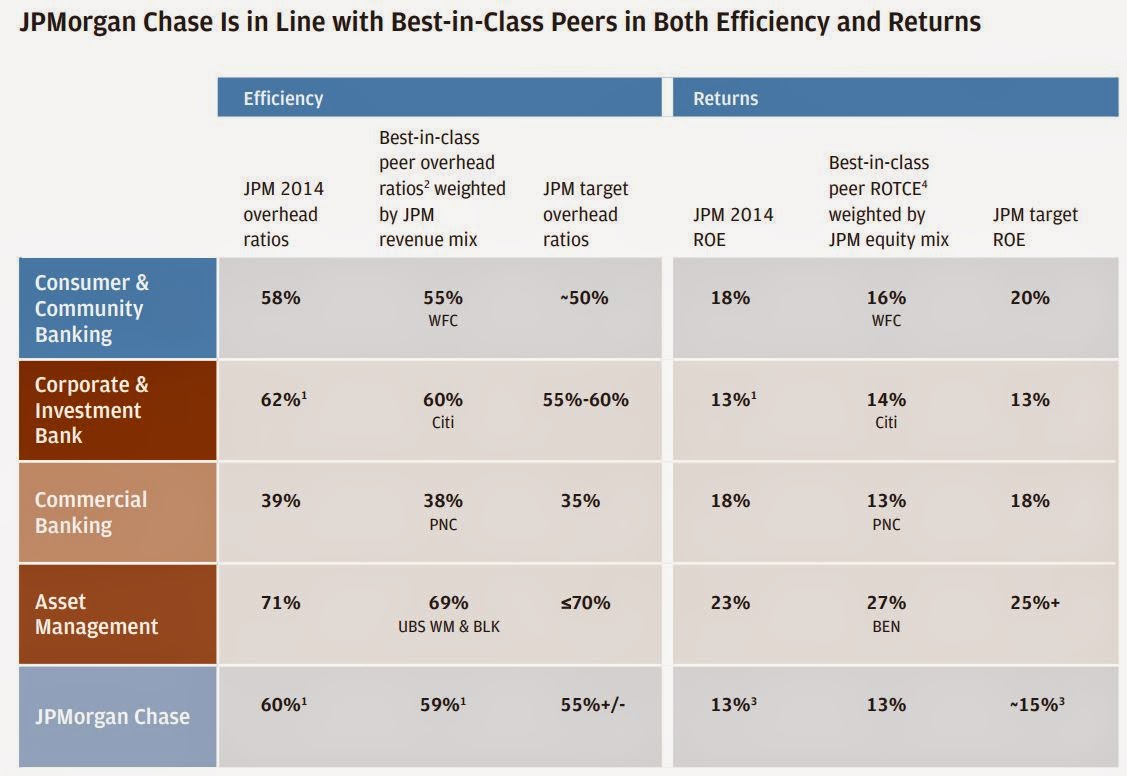
Best in Class by Segment
Efficiency and returns are close to best in class in all segments. Dimon notes that this was achieved while continuing to invest for growth.
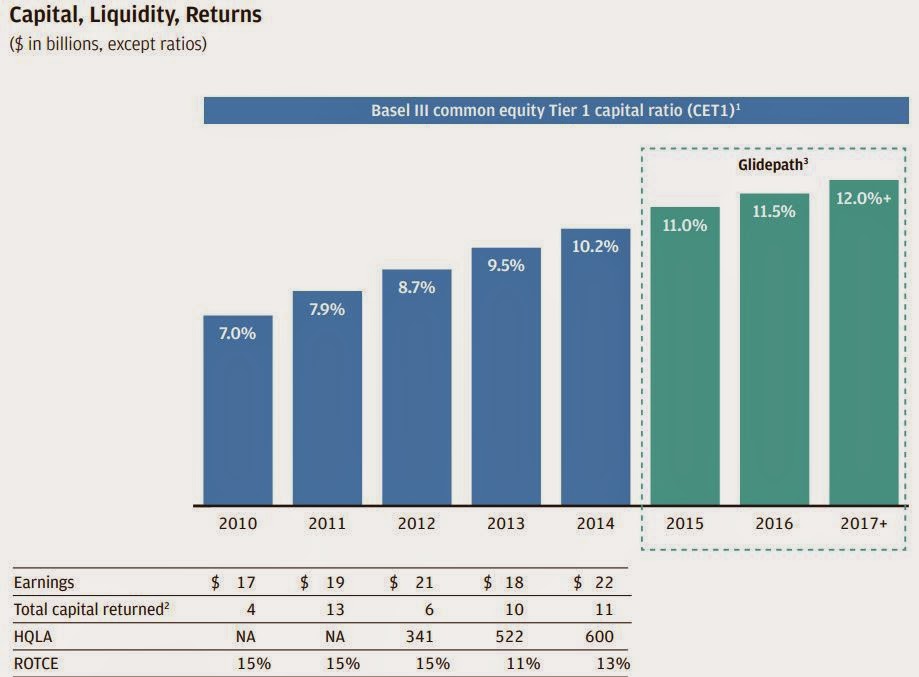
…and while building up capital.
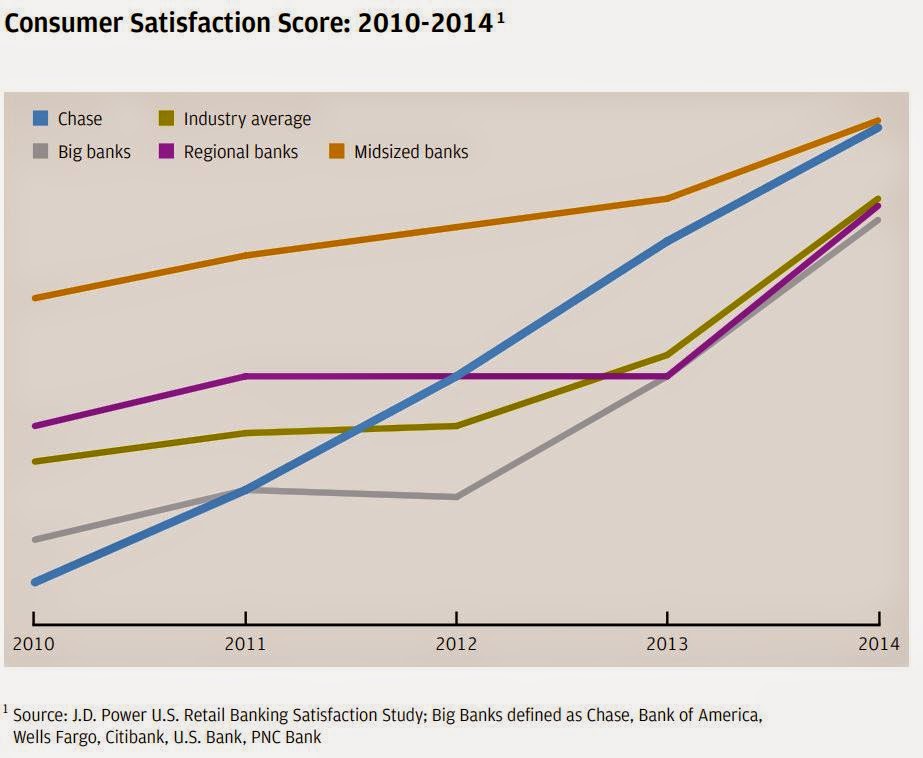
A lot of this stuff was in the investor day presentation, but it’s worth showing again. We tend to think of the big banks as having horrible customer service and those smaller guys with coin/change counting machines and no-bullet-proof-glass-so-gets-robbed-all-the-time smaller banks (that call their branches stores) are popular.
But the gap seems to be closing.
No Split
And here’s the part about the value of JPM as it is.
Our mix of businesses works for clients — and
for shareholders All companies, including banks, have a
slightly different mix of businesses, products
and services. The most critical question is,
“Does what you do work for clients?” Our
franchise does work for clients by virtue of
the fact that we are gaining share in each of
our businesses, and it works for shareholders
by virtue of the fact that we are earning
decent returns – and some of our competitors
are not.
…and later he says:
Our mix of businesses leads to effective cross
sell and substantial competitive advantages. We are not a conglomerate of separate,
unrelated businesses — we are an operating
company providing financial services to
consumers, companies and communities
A conglomerate is a group of unrelated businesses
held under one umbrella holding
company. There is nothing wrong with
a conglomerate, but we are not that. In
our case, whether you are an individual, a
company (large or small) or a government,
when you walk in the front door and talk
with our bankers, we provide you with essential
financial products, services and advice.
We have a broad product offering and some
distinct capabilities, which, combined, create
a mix of businesses that works well for each
of our client segments.
I don’t want to cut and paste everything here, but he goes on to talk about how there are some things that only big banks can do and smaller community banks can’t. Things only global institutions can do etc. Also, he talks about how big is not always more risky.
CCAR
And there was an interesting discussion on the Fed’s stress test. Dimon thinks that JPM will do better than what the test results imply. I’m gonna paste that because it is very interesting:
The Federal Reserve’s Comprehensive Capital
Analysis and Review (CCAR) stress test is another
tough measure of our survival capability. The
stress test is good for our industry in that it
clearly demonstrates the ability of each and
every bank to be properly capitalized, even
after an extremely difficult environment.
Specifically, the test is a nine-quarter scenario
where unemployment suddenly goes to
10.1%, home prices drop 25%, equities
plummet approximately 60%, credit losses
skyrocket and market-making loses a lot of
money (like in the Lehman Brothers crisis).
To make sure the test is severe enough, the
Fed essentially built into every bank’s results
some of the insufficient and poor decisions
that some banks made during the crisis.
While I don’t explicitly know, I believe that
the Fed makes the following assumptions:
- The stress test essentially assumes that
certain models don’t work properly, particularly
in credit (this clearly happened with
mortgages in 2009).
- The stress test assumes all of the negatives
of market moves but none of the positives.
- The stress test assumes that all banks’ risk-weighted
assets would grow fairly significantly.
(The Fed wants to make sure that
a bank can continue to lend into a crisis
and still pass the test.) This could clearly
happen to any one bank though it couldn’t
happen to all banks at the same time.
- The stress test does not allow a reduction
for stock buybacks and dividends. Again,
many banks did not do this until late in
the last crisis.
I believe the Fed is appropriately conservatively
measuring the above-mentioned aspects
and wants to make sure that each and every
bank has adequate capital in a crisis without
having to rely on good management decisions,
perfect models and rapid responses.
We believe that we would perform far better
under the Fed’s stress scenario than the Fed’s
stress test implies. Let me be perfectly clear
– I support the Fed’s stress test, and we at
JPMorgan Chase think that it is important
that the Fed stress test each bank the way it
does. But it also is important for our shareholders
to understand the difference between
the Fed’s stress test and what we think actually
would happen. Here are a few examples
of where we are fairly sure we would do
better than the stress test would imply:
- We would be far more aggressive on
cutting expenses, particularly compensation,
than the stress test allows.
- We would quickly cut our dividend and
stock buyback programs to conserve
capital. In fact, we reduced our dividend
dramatically in the first quarter of 2009
and stopped all stock buybacks in the first
quarter of 2008.
- We would not let our balance sheet grow
quickly. And if we made an acquisition,
we would make sure we were properly
capitalized for it. When we bought Washington
Mutual (WaMu) in September of
2008, we immediately raised $11.5 billion
in common equity to protect our capital
position. There is no way we would make
an acquisition that would leave us in a
precarious capital position.
- And last, our trading losses would unlikely
be $20 billion as the stress test shows. The
stress test assumes that dramatic market
moves all take place on one day and that
there is very little recovery of values. In
the real world, prices drop over time,
and the volatility of prices causes bid/ask
spreads to widen – which helps marketmakers.
In a real-world example, in the six
months after the Lehman Brothers crisis,
J.P. Morgan’s actual trading results were
$4 billion of losses – a significant portion
of which related to the Bear Stearns acquisition
– which would not be repeated. We
also believe that our trading exposures are
much more conservative today than they
were during the crisis.
Finally, and this should give our shareholders
a strong measure of comfort: During the
actual financial crisis of 2008 and 2009, we
never lost money in any quarter.
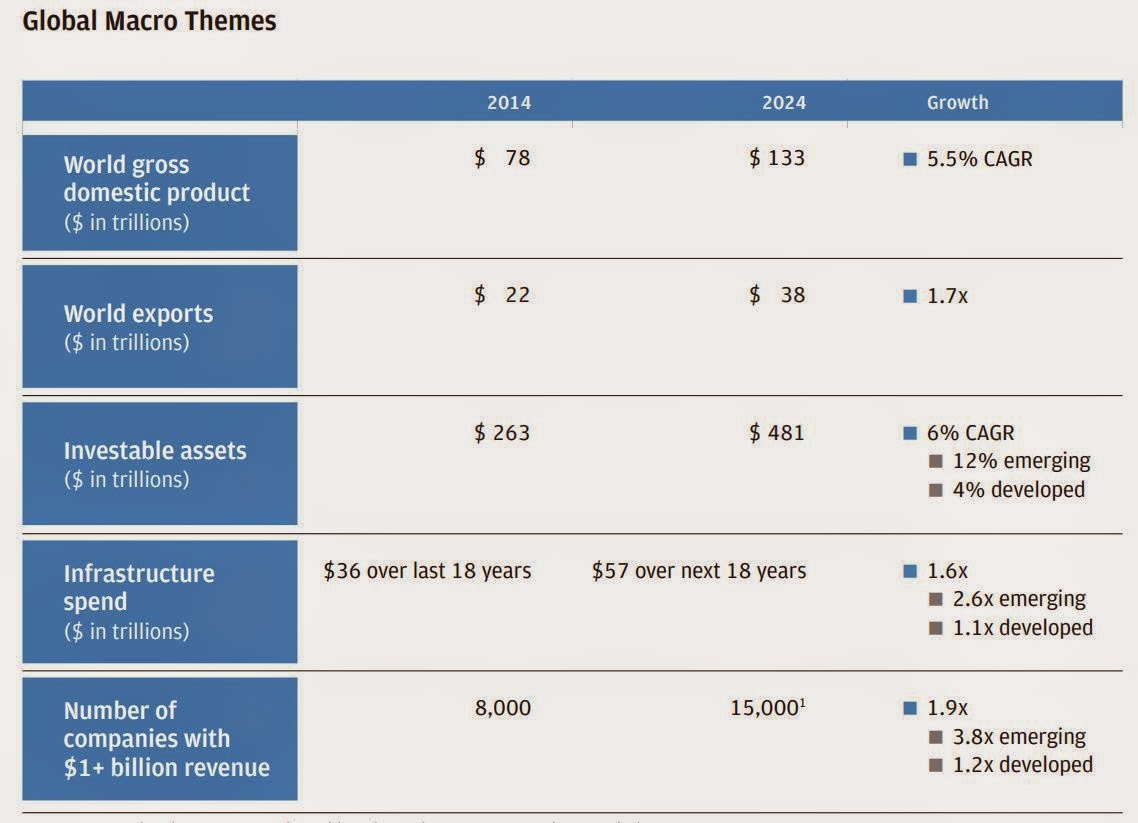
Bullish Long Term
And as usual, Dimon is bullish for the long term outlook of JPM’s businesses. Some of the long term macro drivers are:
No Split Part 2
Earlier in the report, he talked about how the JPM business model is driven by the needs of the customer, how size does not equate to risk, how large banks serve important needs (global, large clients etc).
And later in the report, he addresses the investor calls for a split-up:
Our long-term view means that we do not
manage to temporary P/E ratios — the tail
should not wag the dog
Price/earnings (P/E) ratios, like stock prices,
are temporary and volatile and should not
be used to run and build a business. We
have built one great franchise, our way,
which has been quite successful for some
time. As long as the business being built is a
real franchise and can stand the test of time,
one should not overreact to Mr. Market.
This does not mean we should not listen to
what investors are saying – it just means
we should not overreact to their comments
– particularly if their views reflect temporary
factors. While the stock market over a
long period of time is the ultimate judge of
performance, it is not a particularly good
judge over a short period of time. A more
consistent measure of value is our tangible
book value, which has had healthy growth
over time. Because of our conservative
accounting, tangible book value is a very
good measure of the growth of the value
of our company. In fact, when Mr. Market
gets very moody and depressed, we think it
might be a good time to buy back stock.
I often have received bad advice about what
we should do to earn a higher P/E ratio.
Before the crisis, I was told that we were
too conservatively financed and that more
leverage would help our earnings. Outsiders
said that one of our weaknesses in fixed
income trading was that we didn’t do enough
collateralized debt obligations and structured
investment vehicles. And others said that we
couldn’t afford to invest in initiatives like our
own branded credit cards and the buildout
of our Chase Private Client franchise during
the crisis. Examples like these are exactly the
reasons why one should not follow the herd.
While we acknowledge that our P/E ratio is
lower than many of our competitors’ ratio,
one must ask why. I believe our stock price
has been hurt by higher legal and regulatory
costs and continues to be depressed due to
future uncertainty regarding both.
As I was reading this section (which makes a whole lot of sense), I was wondering what the investment bankers at JPM were thinking when reading this. Imagine JPM bankers consulting a company on a potential split to enhance shareholder value, and the client says, “…but Jamie said that we shouldn’t let the tail wag the dog!”.
Consequences of Regulation
Dimon says that the banking industry is much safer and stronger than ever before and he is in favor of a lot of the new regulations. But he does caution that there are consequences to some of this stuff, and it’s a very interesting read.
For example, the markets are already feeling it a little bit:
Some investors take comfort in the fact that
spreads (i.e., the price between bid and ask)
have remained rather low and healthy. But
market depth is far lower than it was, and we
believe that is a precursor of liquidity. For
example, the market depth of 10-year Treasuries
(defined as the average size of the best
three bids and offers) today is $125 million,
down from $500 million at its peak in 2007.
The likely explanation for the lower depth in
almost all bond markets is that inventories
of market-makers’ positions are dramatically
lower than in the past. For instance, the
total inventory of Treasuries readily available
to market-makers today is $1.7 trillion,
down from $2.7 trillion at its peak in 2007.
Meanwhile, the Treasury market is $12.5 trillion;
it was $4.4 trillion in 2007. The trend
in dealer positions of corporate bonds is
similar. Dealer positions in corporate securities
are down by about 75% from their 2007
peak, while the amount of corporate bonds
outstanding has grown by 50% since then.
Inventories are lower – not because of one
new rule but because of the multiple new
rules that affect market-making, including far
higher capital and liquidity requirements and
the pending implementation of the Volcker
Rule. There are other potential rules, which
also may be adding to this phenomenon. For
example, post-trade transparency makes it
harder to do sizable trades since the whole
world will know one’s position, in short order.
Recent activity in the Treasury markets and the
currency markets is a warning shot across the bow Treasury markets were quite turbulent in
the spring and summer of 2013, when the
Fed hinted that it soon would slow its asset
purchases. Then on one day, October 15,
2014, Treasury securities moved 40 basis
points, statistically 7 to 8 standard deviations
– an unprecedented move – an event that
is supposed to happen only once in every 3
billion years or so (the Treasury market has
only been around for 200 years or so – of
course, this should make you question statistics
to begin with). Some currencies recently
have had similar large moves. Importantly,
Treasuries and major country currencies are
considered the most standardized and liquid
financial instruments in the world.
He goes through a thought experiment on the next financial crisis which is very well worth reading. One of the issues is that regulation is driving some of the loans/financing outside of the banking system and that could cause problems in a crisis. Banks will usually continue lending to support clients during a crisis, but non-banks may not, and this may exacerbate any crisis.
Anyway, that section is well worth reading as is the whole letter.
Oh, and here’s a fun chart from the proxy statement. We know Buffett is the cheapest laborer in the financial business, but Dimon comes pretty cheap too:
Conclusion
It’s a pretty long report, as usual, at almost 40 pages, but it’s really worth the read even for people not that interested in owning JPM. You can’t read a Dimon letter and not learn something. So go ahead, what are you waiting for!?



KK,
Interestingly WFC has the smallest balance sheet but the largest market cap among WFC, JPM, BAC. I don't work in the finance industry, so I don't know much about investing in banks. Would it be fair to say that if assets start exceeding deposits (low-cost), the bank is a riskier one? That is, if a bank uses bonds to fund its assets, and if asset and liability durations match (because we don't want to borrow short and lend long), the bank has to invest in assets riskier than its own bonds? WFC has the highest Deposits/Assets ratio.
For easy access, I have created a page http://www.investingden.com/latestar/ that lists companies with 2014 shareholder letters including the following banks: WFC, USB, GS, MS, MTB, JPM, BK, BBT, C, FITB, PNC, STI, AXP, COF, DFS
Hi,
Yes, you are right in general. The higher the loans to deposits ratio, the 'riskier' a bank might be. But you can't really compare WFC with JPM and BAC because the latter two have huge investment banks attached to them. Investment banks usually have high ROE but lower ROA because they tend to own a large inventory of treasuries etc.
Hi kk,
Here is maybe an idea for a future post : http://stefancheplick.tumblr.com/post/108655724393/the-transformation-of-morgan-stanley-visualized
Hi, thanks for that. Yeah, I've been watching MS for a while and frankly, I don't get it. MS has been talked up, how great Gorman is etc. But they barely make 4-5% ROE. How can that be? The market has been in a historical bull market. It seems like MS is getting out of everything. I am not a big fan. I would much prefer GS.
I put the latest earnings releases at http://investingden.com/latester/
This lets us browse Q1 results easily. I plan to update it daily. I guess I should eventually let people filter the list to stocks they are interested in.
Great article.