Listed Hedge Fund Company
Here’s a listed hedge fund that looks interesting although I don’t own it at the moment. A few hedge funds and private equity houses went public in the past few years and it is pretty interesting because you get to invest with some pretty amazing people. Of course, the performance in many of these vehicles in the past few years have been horrible because many of them went public at the height of the hedge fund / private equity bubble.
Listed Private Equity Funds
Some of the private equity shops do look interesting, but I worry that they have gotten so big in the past few years that I wonder how well they will do. Shops like Blackstone and KKR have done extremely well over time with 30%-40% annualized returns on their funds. But this is when they had assets under management of under $10 billion. It’s one thing to really get huge returns when you only have $2 or $3 billion under management.
If you look at the assets under management of these private equity guys, going over $20 billion (or whatever they are at this point), it gets a lot harder to move the needle in terms of investment performance. I think that was part of the reason why so many of them did poorly in 2007/2008. The funds were so huge that only mega-deals made sense for them. And when you have too many of those guys chasing the few available mega-deals, prices go up and returns go bad. It also encourages them to move into areas where the capital can be deployed in size, like commercial real estate. Oops.
I’m sure Blackstone, KKR, Fotress Investment Group will do well over time, but with so much assets to move, I doubt they will be making 30-40% returns going forward.
Back to Och-Ziff
Anyway, here is one interesting hedge fund (not private equity), Och-Ziff Capital Management (OZM). Och-Ziff is a solid hedge fund shop with a pretty good reputation. It is run by Daniel Och, a former Goldman Sachs trader (Goldman haters and Off Wall Street protestors can stop reading here). They are very specific in the sort of trades they do and pretty much do strategies similar to what is done on Wall Street investment bank proprietary desks; special situations, arbitrage and things like that. None of these strategies are going to return 30-40%/year over time, like George Soros. But they won’t really blow up too much either.
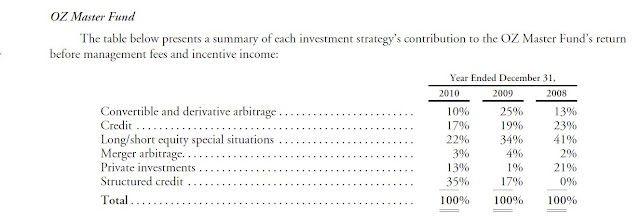
Here is the breakdown of strategies in their flagship fund:
These strategies, for the most part, are long/short type strategies and are typically not highly leveraged like fixed income arbitrage funds (like Long Term Capital Managment). They do sometimes have big drawdowns in stressed periods, but they usually don’t blow up like credit arbitrage guys since they don’t get 10-1 or 20-1 leverage. They deal in vehicles that are known to be very volatile.
(All tables and graphs pasted here are from OZM 10-K, 10-Q’s, presentations and other company filings)
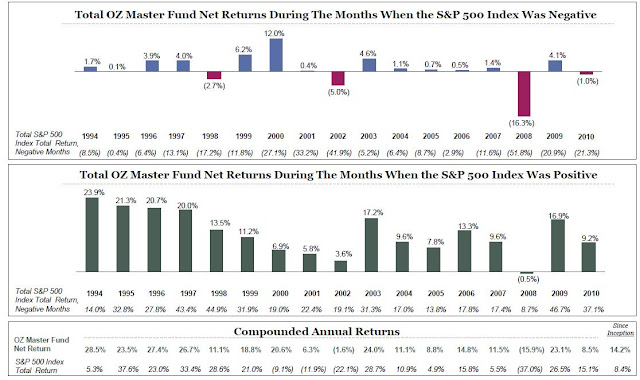
The return table below shows how OZM strategies are pretty non-correlated to the S&P 500 index. The top chart shows the return of the OZM fund during only the down months of each of those years. Between 1994 and 2010, they only lost money three times during the down months of any given year and the rest of the time they made money. That’s pretty good.
On the other hand, they did give up some upside during up months, but they didn’t lose money cumulatively either during up months in those years. This shows the stability of the strategies they use.
They have returns +14.2%/year from 1994 through 2010 versus +8.4%/year for the S&P 500 index. (As an aside, it’s kind of incredible that the S&P 500 index has returned +8.4%/year since 1994 despite having gone through the great recession, 2000 internet bubble pop etc…)
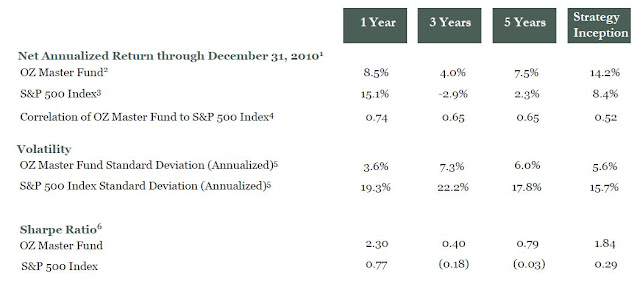
Below is a look at the returns over various time periods for the OZ Master fund. It has nicely outperformed in most periods (except the past year through 2010) with much lower volatility than the S&P 500 index.
How are they doing this year? Here is the returns for the second quarter and year-to-date as of June 30, 2011.
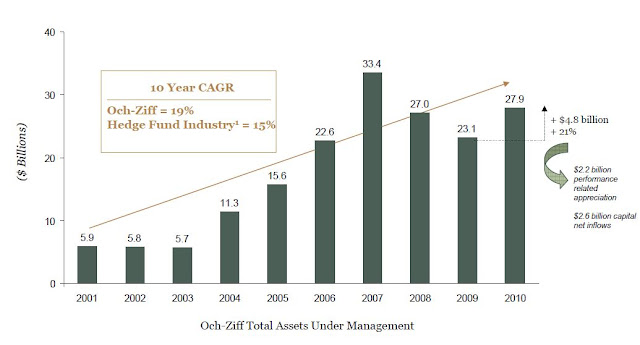
Assets under management has grown substantially too at OZM, from under $6 billion in the early 2000s to $28 billion at the end of 2010. Of course, like the private equity funds I mentioned above, I do think size will be a factor going forward. I wonder if they can continue to achieve 15%/year type returns at the size they are. They will have to look for more trades to put on to absorb the capital.
So OZM was founded in 1994 by Daniel Och and is still run by him. He is still 50 years old so we can expect him to continue to run this thing for a while longer; no succession issue here.
OZM IPO’ed back in November 2007, right around at the height of the bubble, or right before things really started to fall apart. The IPO price was $32/share to the public.
This is, like other recent hedge fund/private equity IPO’s really complex, but to keep it simple, the class A shareholders owns (as of June 2011) 25.6% of the operating business of Och-Ziff. The other 74.4% is owned by the class B share holders. Class B shares are not listed and they are basically Och and his partners.
The income statement shows a $1.6 billion expense item under reorganization cost or something like that, but that is not an ongoing, cash expense. It was part of the pre-IPO reorganization that causes OZM to expense $1.6 billion per year for the OZM class B shares it issued to the original, pre-IPO partners.
Anyway, not to get too bogged down in that, let’s just say that this $1.6 billion expense is something you can ignore. It relates to a stock issuance back in 2007 and the expenses will run for five years after the IPO (so will end in 2012). No cash changes hands; it is amortization of something that already happened.
Before we look at what the business itself is actually worth, there is a couple of other balance sheet items to look at.
Balance Sheet Stuff
There was cash and cash equivalents of $168 million as of June 30, 2011. But there is also $635 million of term debt on the balance sheet, so this isn’t net cash. I don’t think it would make sense to look at the $168 million cash position alone and add it to the per share value of the investment management business.
There is also some consolidated fund positions on the balance sheet that is a little hard to figure out. In the consolidated balance sheet, there is a net $536 million for “Assets of consolidated Och-Ziff Funds” (I netted out the liabilities with the same label). I don’t know how much of these assets actually belong to OZM and how much to investors. The netting of other interests is clumped into one category on the balance sheet.
However, in the VIE (Various Interest Entities) section of the notes to the balance sheet, there is a section “Assets (and liabilities) of consolidated Och-Ziff Funds” listed, and the note says that these assets/liabilities belong to the investors. If I assume that this is included in the consolidated balance sheet section of the same name, then I can subtract this amount from the above $536 million to get OZM’s ownership in their own funds.
The VIE Och-Ziff fund assets listed was a net $258 million. If I’m right, then OZM’s ownership in their own funds is $536 – $258 = $268 million.
Again, this plus cash together is still less than the funded debt on the balance sheet so it may not be fair to include this in a sum of the parts analysis of OZM; $436 million of cash and investments is still below the $635 million funded debt.
If you say that the funded debt is completely carriable by the investment management business and in a split up will have no problem supporting it, then you can add this value of cash and investments as a spin-offable value (but I wonder about that; the lenders are aware of this big chunk of liquid asset for sure; otherwise there would be left only desks, PC’s and some file cabinets as collateral).
But let’s just put a per share value on it anyway. Since OZM class A shares own 25.6% of the whole business, the class A share of this cash and fund assets is $111.6 million, and with 97 million class A shares outstanding, that comes to $1.15/share.
With a $10 current share price, maybe this was much ado about nothing. Even being generous, it would add only 10% or so to the current value of the stock.
There is also $800 million or so of “payable to related parties” or something like that, but that’s ignorable too. This offsets the tax assets on the asset side of the balance sheet. Basically, whatever tax savings OZM gets from amortizing the high cost basis over time (because they ‘bought’ the business from the former partners) has to be paid back in cash (or 85% of it, I forget the exact number) to the old partners; basically there was a tax agreement that pays the tax savings of the new entity to the original partners. This is a common structure in the recent hedge fund/private equity IPO boom).
What is the actual business worth?
OK, so let’s look at the actual business.
The hedge fund business makes money by earning 1. management fees and 2. incentive fees.
Management fees are earned on the assets under management on a fixed basis. OZM fees average 1.7%. Incentive fees are earned on the profits they generate. This is 20% (for most funds. Some funds, like the real estate funds have a different fee structure, but let’s keep it simple).
As of June 30, 2011, OZM had assets under management of $30 billion or so. That means that their rate of management fees is $510 million. Let’s assume that over time they can generate 10% returns. They have done 14%/year over time, but with $30 billion in assets, maybe we should lower that. Also, this is the new, new normal, so it would be conservative to lower the return expectation.
If they earn 20% incentive fee on 10% returns, that’s $600 million/year in incentive fees.
Combine those and you get a run rate revenues of $1.1 billion per year.
What about costs? The great thing, usually, about asset management firms is that they have a lot of operating leverage; their cost base (other than bonuses) is largely fixed, so any increase in assets either from more fund inflows or good returns (usually both) goes right to the bottom line (after big bonuses, of course). Some funds have recently learned that this operating leverage works both ways, though. But OK, that’s a different story.
So we have a revenue run rate of $1.1 billion/year. What is the expense structure of OZM?
For that, I just looked at the the economic revenue and economic income over the past few years to try to see what the operating income margin has been. I don’t know what the normalized economic income margin should be, or the fixed cost base. We can look at both to see what the expected economic income would be. (Economic income is a measure that OZM uses to evaluate results that exclude things like the $1.6 billion reorganization expense).
Here are the two things side by side:
Economic income Economic revenues minus
margin economic income
2006 75.9% $231 mn
2007 72.0% $315 mn
2008 53.8% $271 mn
2009 59.9% $284 mn
2010 60.8% $289 mn
If we assume a 65% income margin, that would be $715 million in economic income. If we use $300 million as the cost base (looks stable at that level in the past few years), we get an economic income of $800 million on a normalized basis.
I agree with using economic income as some one-time things like the reorganization expense really obscure the economics of this business.
However, one thing I don’t agree with adding back, or excluding from the cost base is their equity compensation: they give RSU (restricted stock units) as compensation to employees and the RSUs do earn dividends on them at the same rate as the class A shareholders (that would be 10% at a $1.00 dividend), and the dividends are paid in-kind (they issue more RSUs to pay the dividend on those RSU’s).
This ranged between $100 million to $122 million in the past three years, so I would deduct another $120 (to be conservative) from the above income.
That would give us a range of pretax, economic income of $595 million – $680 million.
This is pretax (this is a partnership so the class A owners pay taxes on partnership distribution and income), so to keep it simple and keep it comparable to other corporations, I will slap a 35% tax on that. That gives us net profit of $387 million – $442 million.
The Class A owners own 25.6% of the whole business, so the class A’s share of this is $99 mn – $113 mn.
With 97 million class A shares outstanding at June 30, 2011, that comes to an EPS of $1.02 – $1.16/share.
At the current stock price of $10.74, it is trading at a comparable (to other corporations) p/e ratio of 9.2 – 10.5x.
In more normal times (when strong financials aren’t trading at under tangible book value), asset management firms tend to trade at 15-20x p/e. I wouldn’t be surprised to see this get to that valuation either over time. Maybe once the $1.6 billion/year reorganization cost runs off and the income statement starts to look better (superficially), people will pay more attention to it and maybe it goes up.
Dividends
Oh yeah, and OZM pays dividends. Their goal is to pay out all their distributable earnings. From 2007 to 2010, the dividends were:
Dividends paid per share
2007 $1.20
2008 $0.27
2009 $0.72
2010 $1.01
Assuming 2010 was not an extraordinary year (they returned 8.5% or so, so nothing special), they will probably be able to pay out $1.00 or more over the next few years. That’s close to a 9.3% dividend yield; not bad at all in this environment.
The problem some people may have is that this will come with a K1 attached since it’s a partnership.
If you assume 9.3% dividends is sustainable, and OZM continues to make money for investors and their AUM continues to go up, it’s not hard to see a decent return going forward.
Anyway, this is just a quick first pass look at this thing and I have ignored a lot of things. This is a partnership, which means the class A shareholders pay taxes and people may have different rates.
Asset management companies generally are good in bull markets due to the operational leverage and things like that, and I do have confidence that OZM will do well over time. I think this is a good, solid firm and Och’s reputation over the years I think has been pretty good.
However, they are getting pretty big in assets under management and people need to be aware that running a company with $5 billion of AUM is very different than running one with $30 billion. They may need to find larger and larger deals, ideas and things like that which will lead to lower hurdle rates on investments etc… If you are too picky with $30 billion, you won’t deploy much capital and if you don’t, your returns will suffer (they may suffer anyway if you overpay for assets).
Also, this is a complicated structure with class A shareholders having very little control. I think Och can do pretty much what he wants to do.
Even if OZM does well, it is possible that class A shareholders don’t do well. Increasing issuance of RSU’s to employees will certainly dilute shareholders over time, and of course, class A shareholders have very little say on executive compensation/bonuses which can be very big at these hedge funds.
This is certainly one to keep an eye on and it is certainly an interesting idea, but with so many other financial companies selling for so cheap (like Goldman Sachs), I tend to like other opportunities better (not to mention the simpler structures of financial corporations versus these complicated partnerships!).
Again, this is not a stock recommendation. Do your own work! If you buy stocks mentioned on anonymously posted blogs, you deserve what you get!
