
Long time!
It’s been a while and a lot has happened since I posted here back in February. But to me, it doesn’t feel like much. The big thing, I suppose, was liberation day. A lot of people asked me about that, and frankly, I just shrugged. What are you going to do? You can’t really predict what’s going to happen. One thing that made me not worry too much about it was that it was a self-inflicted wound, and the problem can be solved through negotiation. I figured, with Trump surrounded by all those billionaires, that if the pain got too extreme, there would be pressure to make deals. We know that Trump just needs to look victorious. We are obviously not out of the woods in that respect with comments about China riling markets again. But what hasn’t changed is that we can’t be trying to trade around this.
I have not been doing much in terms of the market. I have been busy with various projects that have nothing to do with markets / finance. All good. My health and those around me are fine, nothing unusual going on. I am still long, probably too much tech, but there really hasn’t been a lot of reason to do anything except trim some of that tech when I can. I will look at all this bubble talk later in this post; I will just look at the same things I’ve been looking at for years here. But I am really in no rush to be dumping stocks, even tech stocks, at the moment. But more on that later.
Buffett Stepping Back
The other big news is Buffett stepping aside at the end of the year. I was not really all that surprised with that, and was actually relieved to hear it. It may have even been a better idea to step aside sooner to give more time for the next generation to grow into the position while Buffett was still around. There is plenty of time now, I suppose.
I also thought that there might have been a Biden-effect here. Many say Biden should have stepped aside far sooner than he did, but his ego and pride prevented him from doing the right thing. This may have (or may not have) caused a lot of damage to the Democratic party. It may be that Buffett also thought so and didn’t want to pull a Biden at BRK. What if he hangs on for too long? Would it not be better to hand it off while he is healthy enough to watch and advise if needed?
Bubble Talk
Anyway, there is a lot more bubble talk again going on. This is what prompted me to check in, to see what’s going on; are we in a bubble yet? I always talk about the outdated and long discredited Fed model here, but honestly, I am more surprised that every time I read something about the market or turn on the TV, all I ever hear people say is that the market is way overvalued, the P/E ratio is as high as it’s ever been etc. As silly and simple as the Fed model may be (for newbies here, the Fed model just compares the 10-year Treasury rate with the earnings yield of the S&P 500 index), I think it’s far more valuable than just looking at the raw P/E.
I think one big difference between me and the others that just look at nominal P/E ratio is that throughout my career on Wall Street, we always had great respect for the bond market, particularly the U.S. Treasury market. I spent my early career trading futures, options and other derivatives, and let me tell you, everything was priced off of U.S. Treasuries. Everything short term was priced based off of the Federal Funds rate or LIBOR (is that still around?), and anything with longer duration was priced off U.S. Treasuries. It was the benchmark. Long duration assets were nearly always priced off of the 10-year rate.
I am repeating myself, but back in the early 90s, early in my finance career, the image was that the stock market P/E ranged between 7x and 21x or so, and the average was around 14x. P/E over 20x was a no-brainer short. A layup trade. If you told someone back in 1990 that you predict the stock market P/E going forward will average around 22-23x earnings, and the market will trade below 20x P/E only in bad times, they would have thought you’re nuts! But, that’s exactly what happened. Of course, at the time, there was nothing indicating that this would happen.
When I say that if 10-year Treasury yields stay at around 4%, then the market should average a P/E of around 25x over time, it sounds crazy, but given that the market has traded at 22-23x P/E in the last 35 years, this is not so crazy to me.
Of course, one can come back to me and say, well, as much as 22-23x P/E was shocking in 1990, who’s to say that the market can’t shock us again, going back to 6-7% interest rates and 14x P/E ratio over the next 20? This is also true. I can’t say that can’t happen. But I’ve always said that I think 4% or so 10-year rate seems reasonable given 4% nominal GDP growth over time.
Fed Model Now
So, given that, how does the market look today? The market today looks like it is priced correctly. The 10-year Treasury rate is 4% today, and the S&P 500 index P/E is 25.5x, almost exactly where it should be according to the model. Next year’s estimate P/E is 22x.
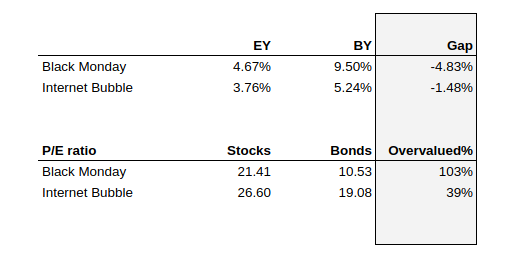
In past bubbles, the rubber band was stretched. The table below is from an earlier post. Just before Black Monday, the rubber band was stretched as 10-year rates spiked to close to 10% while the earnings yield declined to 4.7%, creating a near 5% gap. On a price basis, the market was overvalued by 100%! During the internet bubble, the gap increased to 1.5% and the market was overpriced 40%. Today, there is no stretch in the rubber band.
Nifty 50
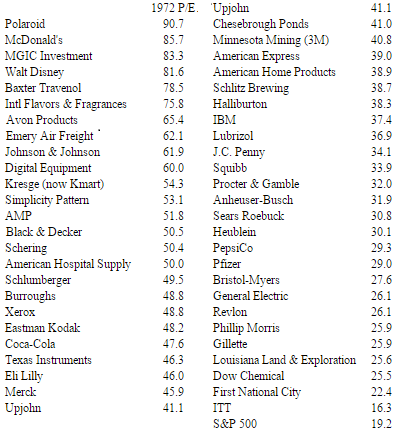
I also posted this table a while back, a table of P/E ratios of the Nifty 50. This is just to get some perspective on what real bubbles look like in terms of valuation. The S&P 500, though, was trading at 19x P/E. So maybe this is not a fair, apples-to-apples comparison. I’m sure we can generate a similar list with similar valuations if we look look at crypto stocks, quantum computing stocks and whatever else is the latest fad. A lot of the focus, though, these days are on the Mag 7, and the Mag 7 are not trading anywhere near these Nifty 50 stocks.
Sanity Check Valuation
Another thing I used to track on the website is just the P/E ratios of the Dow 30 stocks. Sometimes, just looking at the S&P 500 index P/E doesn’t tell the whole story. Is a few, large stocks skewing the P/E up? Maybe there are huge losses that deflate the E, making the P look high. What does the ‘typical’ stock look like?
So just browsing the Dow 30 stocks and their P/E ratios give us a little bit of an insight. This is much more manageable than trying to do this with 500 stocks.
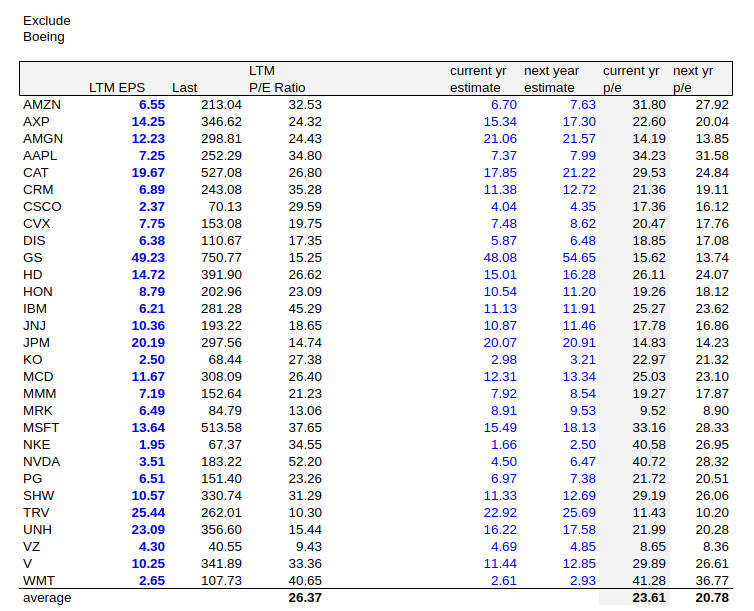
Looking at the table below (I exclude BA here as they are losing money), the Dow 30 stocks (or 29) have a simple average P/E of 26x, with current year estimate P/E of 23.6x and next year P/E of 20.8x. Given that at 4% long term rates, that a 25x P/E is ‘normal’, this doesn’t seem to indicate a bubble either. Only three stocks have a P/E over 40. Surprisingly, one of them is WMT, at 40.7x P/E. The others are IBM and NVDA. Not all that bubblistic.
This makes me wonder, if the market is OK at 25x P/E, then what is a really good company worth? In a market that trades at 14x P/E, great stocks traded at 20-30x even 40x. But if your average stock is trading at 25x, then really good stocks might be worth much more.
By the way, just for reference, META and GOOG hover around 25-27x ttm and ntm P/Es. Not very bubble-like either.
5-year Returns
We know that bubbles also have really high recent returns. This contributes, of course, to the bubble. Looking at it this way, we are not really in bubble territory yet either.
Total return for the S&P 500 index for the past five years is currently around 17%/year. Up to the peak in the market during the internet bubble in August 2000, this was +24%/year. I couldn’t find the S&P 500 total return index for 1982-1987, but just on price, this was 21%/year up to September 1987. With dividend yields of around 3-4% back then, total return was probably also around +24-25%/year. ChatGPT on my Macbook says total return was 27% in that period (on my desktop, it says it can’t find total returns for this period. Go figure). The Nikkei 225 index had 5 year returns (excluding dividends) of around 28%/year up to December 1989.
The market would have to rally another 30% very quickly to get 5-year returns up to 24%/year. This is what people are looking at, I suppose, when they call for a “blow-off” top.
6% Deficit
Of course, with my anchoring to 4% (or 5%) 10-years Treasury rates, we have to also talk about the elephant in the room. Yes, the deficits are a concern, and no, it can’t go on forever. But I also remember all the talk about the twin deficits in the late 80’s and early 90’s, how things are unsustainable and all that. And look what happened. I don’t mean to say deficits don’t matter. They certainly do. But I just want to sort of point out that these things have usually been terrible things to base investment decisions on.
Gold
Many of us have no interest in gold, but I got curious as it rallied to up over $4,000. I get it, that the world has to inflate it’s way out of its debt, that China and others are accumulating gold as they lose faith in the U.S. dollar and other currencies. That if institutions invested x% of their assets in gold it would go to $y; all the usual stuff.
But I still don’t really care much about it, and have no interest in holding some “just in case”.
Out of curiousity, I was wondering where gold prices were now relative to inflation. I remember reading years ago that gold tended to hold its value against inflation over time. I thought I saw a chart or something showing how gold basically tracked inflation. So where does a $4,300/ounce gold price leave us in terms of long term inflation?
Back in 1933, when FDR took us off the gold standard, gold was valued (or revalued) at $32/ounce. If, since then, gold tracked inflation exactly, gold would be trading at around $800/ounce now. When Nixon really let things go and took us off gold in 1971, gold was still at $35/ounce. If gold tracked inflation since then, gold would be trading at $280/ounce today. During the big gold/silver bubble of 1980, gold peaked out at $850/ounce. If gold tracked inflation since then, it would be trading at $3,300/ounce today. Now, it’s trading at $4,300/ounce, so we are above the inflation adjusted 1980 peak. What does that mean? I am not sure. Incidentally, the DJIA was also around 850 (ranged between 750-1000) back in 1980, and it’s close to 47,000 now.
AI Bubble
So, the other thing is all this talk about an AI bubble. It is really interesting and I have no idea what is going to happen. But there seems to be two extreme views that both can’t be right. On the one hand, some people fear all these trillions being invested into AI infrastructure (energy, data centers etc.) will not offer decent returns on investments as there is still very little revenue associated with many of these big AI models. On the other hand, there is a big fear that AI will wipe out entire industries. There are already reports that huge increases in productivity is being actualized in the coding world, so much that the word is that entry level computer science positions are completely gone, wiped out. Big tech have also been firing a lot of engineers as they are replaced by AI.
They both can’t be right.
Here’s some bogus math, just as a sanity check too. Let’s say AI replaces 10% of jobs in the U.S. There are 160 million workers in the U.S. Ridding 10% of them is 16 million jobs gone. Many of these replaced jobs will be office jobs (well, AI will eventually replace Uber and truck drivers, farmers, factory workers too). Let’s say office workers cost companies $100K / year, including benefits. I’ve heard this somewhere before. That’s $1.6 trillion in expenses that you can cut. How much would you be willing to invest to cut $1.6 trillion?
You are now talking about trillions of dollars in investments. Now, all those numbers people throw around don’t sound so silly anymore. Of course, you can’t just say spending $10 trillion to eliminate $1.6 trillion is a 16% return on investment, as AI costs money to keep running / maintaining and you need to replace servers every 3-5 years etc. But still, you start to see the magnitude of what can happen if AI really starts to replace workers. I do believe workers will be, or are already being replaced now with AI. It’s not really about counting how many people are subscribing to chatGPT and whatnot.
But then again, these things always go too far; people invest too much and at some point there is overcapacity. This is definitely a concern, and I have no great insight into when this might happen.
Just happy to see a post, after several months. You are my OID since 2010, random infrequent posts always worth reading
What happened to Henry Emerson?
Don’t know what OID means, but if it’s something like“go-to guy,“ ditto.
Great post
I’ve been reading your blog since atleast 2010 as well! Way before x and all that. Thx for sharing your thoughts
Glad that you’re back! I hope this is the beginning of a new series and not a one-off, always a pleasure to read you and think along with you 💚 🥃
Are you “veryearly” ?
😉
I think the gold expansion should be compared to the USD expansion. Not inflation which is a complex calculation with all sorts of adjustments. (Read changes and manipulations)
So, if M2 has increased with 6-7% a year and they dig up gold at a rate of 1-2% a year, the gold in USD terms should average 4-6% a year.
For me, Gold is a pure ‘faith’ investment (like… well, all currency) and the current price is a reflection of overall trust in governments, more than inflation (which also contributes).
Great to have you back. Always thought-provoking.
On the recent returns, 2022 obviously skews the picture. I found Elliot’s recent commentary (courtesy of Gavekal Research/Macrobond) compelling: US adding $20T to equity markets in 2.5 years (bringing the total to ~$60T as of end of Q2).
That being said, I completely agree with the analysis around P/E ratios. Coatue pointed out the same in their recent investor deck (https://drive.google.com/file/d/1Y2CLckBIjfjGClkNikvfOnZ0WyLZhkrT/view). However, I have a hunch that the growth of private markets distorts our view of excess capital flows creating bubbles. Per the Coatue deck, equity issuances are something like ~50 this year compared to ~500 in [2000]. If there’s a bubble today, it’s in portfolios of venture capital and private equity, not public markets.
Best thing I’ve read all week. Thanks.
🔥🔥Excellent thoughts and perspective as always!
“This makes me wonder, if the market is OK at 25x P/E, then what is a really good company worth? In a market that trades at 14x P/E, great stocks traded at 20-30x even 40x. But if your average stock is trading at 25x, then really good stocks might be worth much more.”
Thanking you and Howard Marks for feeding my confirmation bias.
Great stuff. Good to see you posting again. It’s like hearing from an old friend after months of silence.
Love hearing your ruminations. I agree with your Macbook. I cobbled together* a spreadsheet that attempts to calculate S&P total return in the olden days. It’s only from 12/31 to 12/31 from 1927 to 1969, and then it’s monthly from then until now. For the 5 years ended 9/30/1987, it says 26.7%.
* using info from Shiller and former UNH professor Etebari
Would be interested in updates or new posts
It’s been a while since I’ve read a blog. Thank you for your wisdom.
Thanks
Great post as always.
With regard to the “Bogus AI math”:
One question you need to ask (and answer) is also, how quickly you can cut the workers. Does ist take 1, 3, 5 or 10 years ? 80% of AI Datacentre Capex (or so) are “perishable” GPUs, so time is quite important in order to actually get a decent ROI. Sometimes it doesn’t pay to be a first mover.
That’s a good question. One reason why its “bogus” math. But it’s also true that the many, many billions / trillions expected to be spent is over time also. Big tech stunned the world with their $100 billion capex this year, but that’s $100 billion each for some of the big tech, not quite trillions. Also, I think Pichai said that 50% of this AI capex is actually for infrastructure; building, roads, HVAC and whatnot to house the data centers, implying that that spending won’t have to be replaced every 3-5 years…
But who really knows.
Buffett agrees with your sentiment, in 2019 he commented on the supposed bubble in stocks at the time that if the long bond was going to stay around 3% then stocks were ridiculously cheap.
‘Buffett – I probably could not have conceived of a world…. As recently as 10 years ago I could not have conceived of a world where you would have full employment, 5% budget deficits with actually the probability of those rising from that level, and at the same time have the long bond at 3%. I would have said that that couldn’t happen. The convergence of these factors would have seemed impossible to me and generally if I feel something’s impossible, it’s going to change. Over time I don’t know in what way. I don’t think we can continue to have these variables in this relationship. Now if we can… Stocks are ridiculously cheap’.
Thanks for the quote
Always find value in your insights. Thanks for sharing.