So this is just a quick look at an old trade. Tokio Marine Holdings has always been known to own a lot of equities and the stock often traded at a discount to it. A long time ago before insurance companies started to mark their stockholdings to market, it was a classic value play where the real ‘value’ wasn’t represented on the accounting balance sheet.
This is an old Marty Whitman (Third Avenue Value) favorite, and I noticed that the Third Avenue International Fund still owns it (but not much compared to other non-Japanese insurance companies).
Anyway, Japan is taking a beating for various reasons and even though I am itching to get bullish Japan I’m not quite there yet. As I keep saying, so many things have sort of lined up for Japan to be a great opportunity; bear market for 20+ years, universally unloved, time for a turn etc. But even if the idea sounds good, the bottoms up view looks horrible (low ROEs across the board, shareholder unfriendliness etc.).
But I thought I’d take a look at this as it would be a nice way to play Japan.
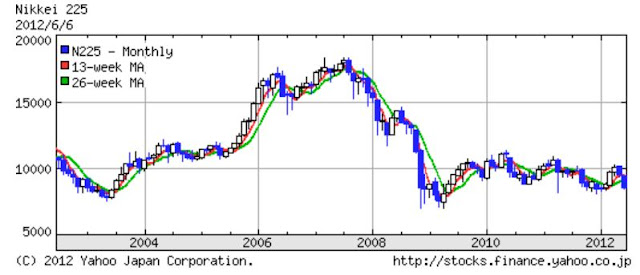
Anyway, here is the 10-year chart of the Nikkei 225 index. It’s basically heading back to the lows of 2009.
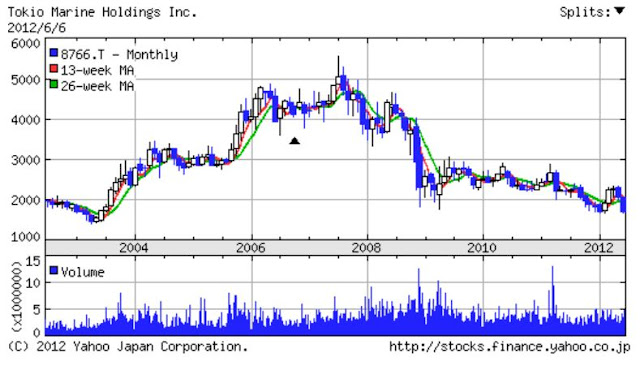
and here’s Tokio Marine Holdings (TMH; TSE ticker 8766):
TMH is the oldest and largest property/casualty insurance group in Japan and as far as I can recall, it has been well-regarded in terms of management. At one time they renamed themselves Millea Holdings and filed 20-F with the SEC and had a U.S. listing. They have delisted from the U.S.
Anyway, here is the U.S. GAAP combined ratios (for the P/C business) for the period when they were listed here:
Combined
ratio (U.S. GAAP)
1999 95.0%
2000 98.8%
2001 99.8%
2002 94.3%
2003 91.7%
2004 92.6%
2005 103.2%
2006 97.2%
This is just to show that it was a decent business under U.S. GAAP; no funky accounting (not that U.S. GAAP is not funky).
TMH was actually formed in 2002 after the merger between Tokio Marine and Nichido Fire (and renamed at the time Millea Holdings).
Here are some basic figures for TMH:
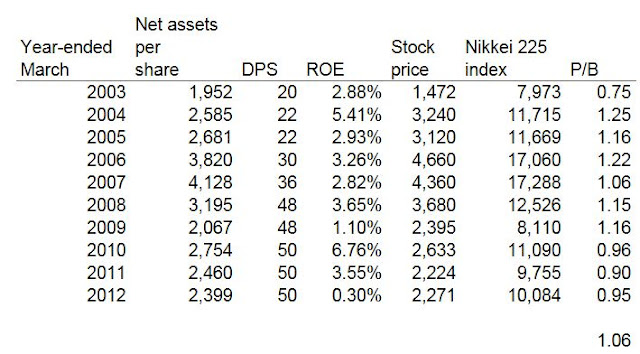
This is all Japanese GAAP based. Net assets per share is basically what we would call shareholders’ equity. In Japanese GAAP, the shareholders’ equity is adjusted by what we would call accumulated other comprehensive income (securities marked to fair or market value) and the adjusted shareholders’ equity is called net assets.
I put the ROE figure in there, but that’s sort of meaningless as it includes gain on sales of securities but not changes in values of securities holdings.
So it seems that TMH trades pretty close to net assets much of the time since 2003, averaging about 1.06x.
2009 1.46% 1.8%
2010 1.20% 2.0%
2011 1.53% 2.0%
Average 1.19% 1.9%
(investment income to average assets for EWJ as of August of each year; TMH dividend to net assets is as of March of the following year)
In the chart above, between 2002-2012 (March-end), the Nikkei rose 2.64%/year while TMH net asset per share grew 2.32%/year. The Nikkei did 0.32% better.
For the past five years, the Nikkei declined 10.2%/year and TMH declined 10.3%/year for around a 7 bps difference. However, the dividends to net assets at TMH was 0.73% higher than for the EWJ (Japan proxy) as seen in the above table.
That’s really not much, but it is positive tracking error, or positive slippage.
Nothing to get excited about, though.
TMH Stock Holdings
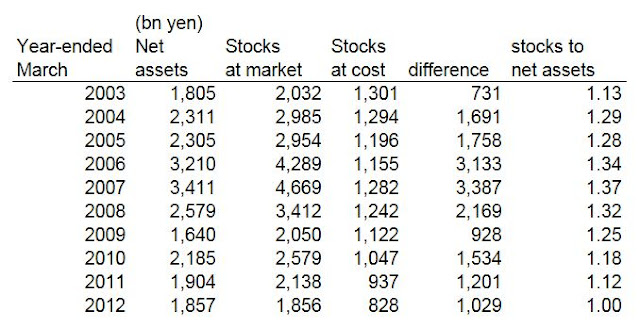
So this is where we get to the fun stuff. Check this out:
The net assets is, as I said above, what we call shareholders’ equity. As of the end of March 2012, the net worth of TMH was around 1.9 trillion yen. TMH has a large equity portfolio and this, at market value, was also 1.9 trillion yen. So basically, if you buy TMH stock at book value, you are getting a Japanese equity portfolio; the net assets will move up and down with the stock market plus or minus whatever the insurance business does.
Needless to say, if you are bullish the Japanese stock market, you can see why this would be an interesting idea. You get one-for-one Japanese stock market return plus something extra. That’s sort of like buying an equity fund but getting paid a management fee instead of paying it, isn’t it?
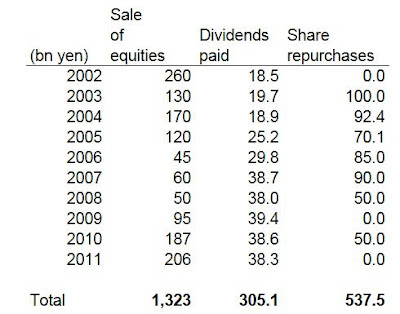
This is not a static situation, though, as TMH is in the process of selling down their equity portfolio. Here is the history of the amount of sales since 2002 (in billions of yen):
Since 2002, TMH has sold 1.3 trillion yen worth of stock out of their portfolio of equities (held for business relationships). Naturally, the question is what they do with that cash. From the above, it seems that they have spent 305 billion yen on dividends and 538 billion yen on share repurchases, so a little more than 60% of sales proceeds was returned to shareholders.
It’s also remarkable that even though they sold 1.3 trillion yen in stocks out of their portfolio since 2002, stocks at market value are still 1.9 trillion yen versus 2.0 trillion yen back in 2002.
What’s in the Portfolio?
With the entire net worth of the company invested in equities and it being the primary driver of value and share price, obviously we would want to know what’s in the portfolio. In the Japanese filings, there is a list of names of the largest holdings. The annual filing for the year just ended hasn’t been filed yet (similar to 10-K in the U.S.), but here is the top ten names from last year’s filing:
Total value of the equity portfolio was 2.1 trillion yen.
Positions as of March 2011:
Name #shares Value (yen at market)
Toyota Motor Corp 67 mn 225 billion
Mitsubishi Corp 84 mn 195 billion
Honda Motor Co. 56 mn 176 billion
Mitsubishi Estate 37 mn 52 billion
Nissan Motor Co. 65 mn 48 billion
Asahi Glass 43 mn 45 billion
Suzuki Motor Corp 20 mn 37 billion
Terumo Corp 8 mn 36 billion
Samsung Fire & Marine 1 mn 27 billion
Itochu Corp 31 mn 27 billion
Total: 868 billion
Toyota itself was more than 10% of stock holdings (and therefore also 10% of net asset value of TMH and the market cap). Mitsubishi Corp and Honda are also close to 10%. From there the concentration tapers off as the fourth largest holding is less than 3% of the equity portfolio.
Negative Management Fee?
So let’s see. How do we know that this so-called management fee is negative and not positive? Does TMH make money as an insurance company?
Since TMH has a combination of businesses, from domestic property and casualty, domestic life and international, we can’t just do a simple combined ratio analysis.
So I did something simple. It may not be clean, but it sort of makes sense to me.
If you look at the table above, you will see the equity portfolio at market value and at cost. So you notice that the equity portfolio at cost was 1.3 trillion yen back in 2003 but is down to 828 billion yen in 2012. That’s because they are selling down their equity holdings.
Most of this portfolio is part of the Japanese cross-holding thing; they own the shares to enhance business relations with partners (clients, basically).
I was going to use the above ROE to show that the business makes money even without equity gains, but since ROE includes “realized” gains, that’s no good. How do we know that TMH hasn’t simply sold just enough stock every year to show a profit?
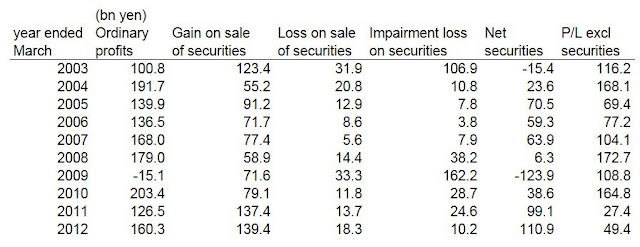
Ordinary Profits Less Gains on Sale of Securities
So to check that, I decided to just take the ordinary profits of TMH and then deduct gain on sale of securities less loss on sale of securities (to deduct “net” gain on sale of securities) and then deduct impairment loss on securities.
This way, I would get a sort of non-market related profit of TMH. It does include investment returns as far as interest income and dividends go. I also left in their trading gains and losses as those aren’t part of the liquidation of the large equity portfolio. The impairment losses are not necessarily equity portfolio losses, but I decided to take that out too as that is not really an ordinary, business profit/loss.
So judging from this table, it looks like TMH is profitable even excluding the gain on sale of securities, much of which is the equity portfolio.
I think it’s safe to say that the “management fee” is negative. There may be other extraordinary gains to offset operating losses here and there, but I think the securities gains are the bulk of the lumpy gains.
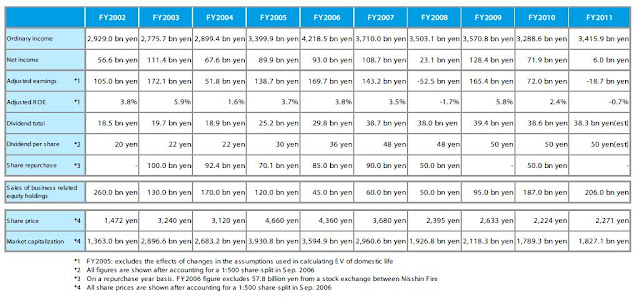
The annual reports include something called the “adjusted earnings” and “adjusted ROE” and also “adjusted BPS”, but I don’t have the comfort with those figures yet but they can be proxies too of profitability excluding market factors. Adjusted earnings excludes all non-recurring, extraordinary items and realized and unrealized gains/losses on securities, derivatives, swaps etc.
One part I don’t get comfort with is that it uses “embedded value” (EV) for the life insurance segment. The change in EV is the adjusted profit in that segment. Also for adjusted BPS, the life insurance segment is valued using EV, which is basically like the ‘gain on sale’ concept where you present value the profits you expect to make over the life of a policy. EV is this present value of profits plus net assets.
Also, for the P/C segment, “adjusted earnings” exclude reserves for catastrophes and these reserves are added back for adjusted BPS too (so BPS becomes much higher).
Anyway, it can still give you a feeling of the business over time excluding the stock market and other gains and losses. The message is still the same; TMH is a low return on equity business but pretty consistently profitable.
Here’s a table that includes the adjusted earnings and ROE from a May 2012 presentation:
A U.S. GAAP Bonus?
I noticed that during the years 2003-2006, the net assets reported in Japanese GAAP and shareholders’ equity under U.S. GAAP had a difference of about 1 trillion yen. Here are the figures:
Japanese GAAP U.S. GAAP
(bn yen) net assets Shareholders’ equity Difference
2003 1,805 2,824 1,109
2004 2,311 3,408 1,097
2005 2,305 3,433 1,128
2006 3,210 4,440 1,230
I am no accounting expert, but on the 20-F, there is a reconciliation of total assets from Japanese GAAP to U.S. GAAP, and the large items are:
- adjustment to recognize deferred policy acquisition costs (around 500 bn yen)
- adjustment to present prepaid reinsurance premiums on a gross basis (around 300 bn yen)
- adjustment to present reinsurance recoverable on losses on a gross basis (around 300 bn yen)
This is not listed in all of the 20-Fs, so I just looked at 2005 and 2006 and it seems that these are the large items. There are other adjustments and some may see something else, but to me these looks like the bulk of the difference.
OK, so what’s all of this worth? If you just look it up, TMH looks like it’s trading at 0.77x BPS, pretty cheap. And if the equity portfolio is as big as BPS, then that’s really awesome. You can buy a Japanese stock portfolio at a 23% discount and get all the other income (P/C insurance, life insurance) for free! (It’s not a stub trade, though, since the equity portfolio constitutes part of ‘capital’ of the insurance companies so is not all separatable).
But of course, with so much stock on the balance sheet and a big decline in the market since March-end, we have to adjust this book value to the current level. I will just assume that the portfolio moves the same amount as the index.
The Nikkei 225 index closed last night at a around 8,640 versus 10,084 at the end of March. That’s a 14.3% decline, so we will just adjust the equity portfolio down 14.3%.
At the end of March 2012, TMH had 1,857 billion yen in the stock portfolio. That is a haircut of 266 billion we need to shave off. With 767 million shares outstanding, that’s 347 yen/share we have to knock off of the net assets per share as of the end of March, which was 2,399/share.
That leaves us with a current net assets per share of 2,052 yen/share. The stock is currently trading at 1,836/share so it’s trading at 0.89x net assets per share.
Conclusion
I am no expert on the insurance industry, and especially the Japanese insurance industry, but TMH is generally a well-regarded company. They seem to do well, at least by Japanese standards. There are risks going forward as the insurance business is very competitive. TMH is also expanding internationally and that’s always a risk; it may not go well. Time will tell.
Also, they have gotten through the recent disasters OK (large losses from the earthquake was averted due to earthquake reinsurance from the government etc.).
Although I am not as excited about Japan as I want to be, this is definitely an interesting vehicle to play it. If they do well in the insurance businesses and the Japanese stock market comes back to life, there can be some significant upside here.
The discount is modest so not so large to make this a pound-the-table interesting idea, but it’s certainly not a bad one.
I don’t own any here, but I will certainly keep an eye on it.



Excellent and straightforward analysis, according to the facts presented I do not think that the margin of safety is high enough to take a position, especially given the macro risks…
however it might be worthwile to look up the causes for the difference in NAV between Japanese and US Gaap. In case the US Gaap figure is more realistic, you might be up to something, I guess..
Best regards
Thank you for sharing your very interesting analysis!
Buying TMH would also imply to get a very large exposure to Japanese Government Bonds. Concerning the low yields and Japanese debt levels could the discount from Book value to equity securities not be offset through higher yields on government bonds or even distress?
best
Hi, yes you would be exposed to JGBs; all insurance companies own a lot of local government debt, so if you believe in the Einhorn Japan blowup scenario, TMH is obviously not a good idea. If yields rise on a stronger economy, though, it's not hard to imagine equity gains outpacing losses on bonds. If yields rise Greece-style, well then, that's a different story!
Hi, thank you for the answer! "If yields rise on a stronger economy, though, it's not hard to imagine equity gains outpacing losses on bonds." Very good point.
If you like Japanese stocks, check out SK Kaken (I own it.) It is a growing paint company. Cash per share = 2800 JPY, EPS = 460 JPY, and stock price = 3035 JPY.
Thanks for the tip. I know there's a lot of net-nets in Japan, stocks trading below cash etc… But it's sort of always been like that and there isn't a mechanism to get that cash out (check out Jim Grant's attempt over the years; he shut down his Japan net-net fund after years of waiting for value realization).
People are talking about it a lot again so maybe I'll take a look at this one and some others. If I find anything interesting to say, maybe I'll make a post about it. Most of the time, though, there just isn't a whole lot of information available on the smaller names (and I'm not going to go visit them, which is the only way sometimes to figure out what the plan is going to be for the cash)…
It probably is a decent 'basket' trade, though. At worst, nothing happens…
This is not relating to the article. You have written a lot of interesting and high quality companies such as LUK, MKL, L… erc. I am just wondering if you do look at Brookfield and what do you think about it. BTW, I love your blog! Very interesting.
Hi, thanks for the comment. Yes, I think Brookfield is a great company too and thought about posting something here. But they really present their assets well including what they think the intrinsic value of the assets are.
I try to post stuff here if I have something to say or have something to add to what's out there and in Brookfield's case, at this point, I love reading their reports and whatnot, but I haven't thought of any aspect of it that I can dig into to add insight at this point…
kk – Great post, and great blog. Do you have an e-mail address where you can be reached?
I don't have one posted but I can email you if you give me an email address (I will delete the post once I get it).
This comment has been removed by a blog administrator.