So, Buffett’s response (at the 2015 annual meeting) to questions regarding the valuation of the stock market was interesting. He used to just say it’s in a “zone of reasonableness”, but this time said that if interest rates stay at current low levels, the stock market is cheap, and if interest rates normalize, it is expensive. Well, he has been saying for a while that stocks are better than bonds.
We know there is a relationship between interest rates and stock market valuation. Some criticized the old Fed model (10-year bond yields compared to the earnings yield of the S&P 500 index) saying that there was a correlation between the two for only a short period in history but there hasn’t been a correlation between them for most of history. This is true, but it is also true that there is a logical connection between them so we can’t deny a relationship just because we can’t get some charts to look convincing.
Anyway, just for fun, I decided to play around with some figures. My goal was actually just to see what the stock market should be valued at if interest rates normalize. I did that before, but this time I wanted to do it empirically.
One thing I don’t advocate or call for is for the stock market to catch up to the bond market. If it did, then the P/E ratio of the market would get to 50x, and that’s too expensive. At that level, even I would pound the table to get out of the market.
So first of all, we’ve already seen the many charts comparing bond yields to earnings yields and how they have tracked each other closely (and diverged) in recent years. So I decided to look at it a different way; by X-Y plotting it. This is nothing new; strategists do this sort of thing all the time (as I used to too back in the old days).
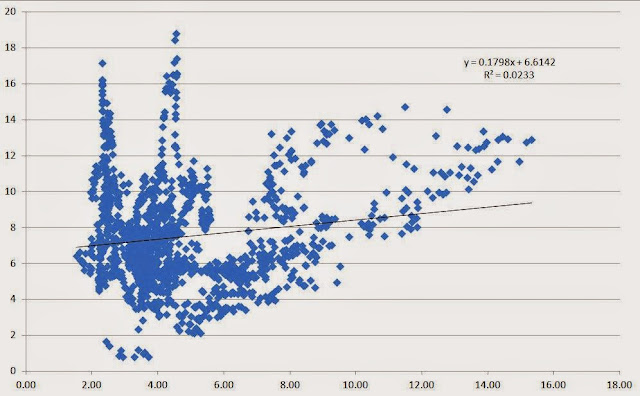
This is the data from 1871 through the end of 2014. The earnings yield is on the Y-axis and the 10-year bond rate is on the X-axis. (all data is based on the S&P 500 index (and predecessors for older data), ttm earnings from Shiller’s website).
Wow. Looks like a raptor claw. So the Fed model critics are right. The R² is basically zero. But we knew that.
The two vertical clusters are from the era when interest rates were low. The cluster to the left is when rates were around 2% and the stock market got cheap in the late 1940’s and early 50’s. The second vertical cluster (or claw) was when the market swung around in 1915-1920. Excluding those two periods, there seems to be sort of a linear relationship.
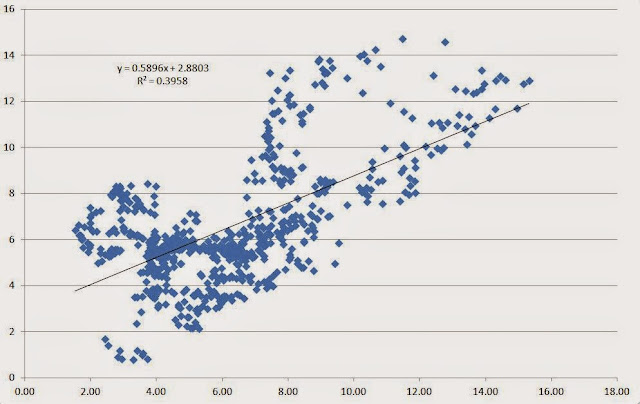
So let’s see what happened since 1955:
Now we see a little bit more of a clear slope, verified by the higher R² of around 0.4.
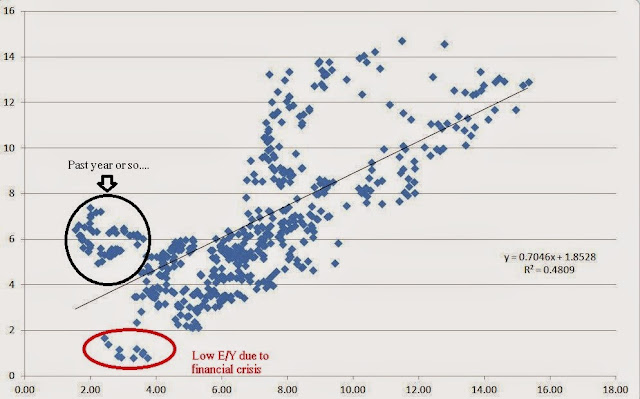
Not that different, but here it is from 1970:
We can see that the stock market didn’t continue down the slope as rates declined. The dots all the way at the bottom when interest rates were between 2% to 4% and earnings yield dipped below 2% was just from the financial crisis; the E declined dramatically.
Eye-balling this chart, even if rates got back up to 6%, the stock market valuation would still be reasonable; no need for a valuation adjustment.
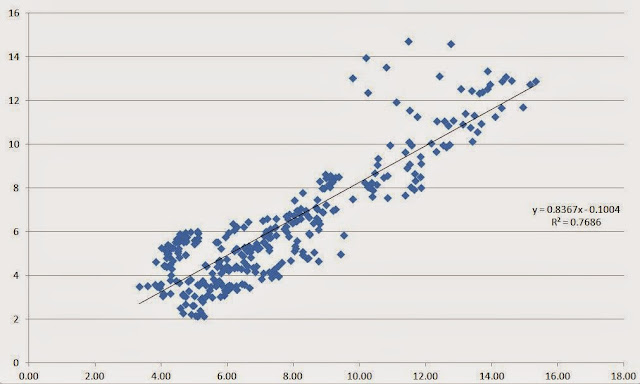
Just for fun, I took out the data after 2007. Let’s look at this from 1980-2007:
Obviously, the R² increases and the slope gets closer to 1 (0.8367).
So we see that stock prices are cheap at current interest rates, but the thought is that they may become expensive if interest rates “normalize”.
But what does it mean for interest rates to normalize? From the above charts, it looks like the stock market can be in the fair value range even with rates going back up to 6% or more.
What is “Normal”?
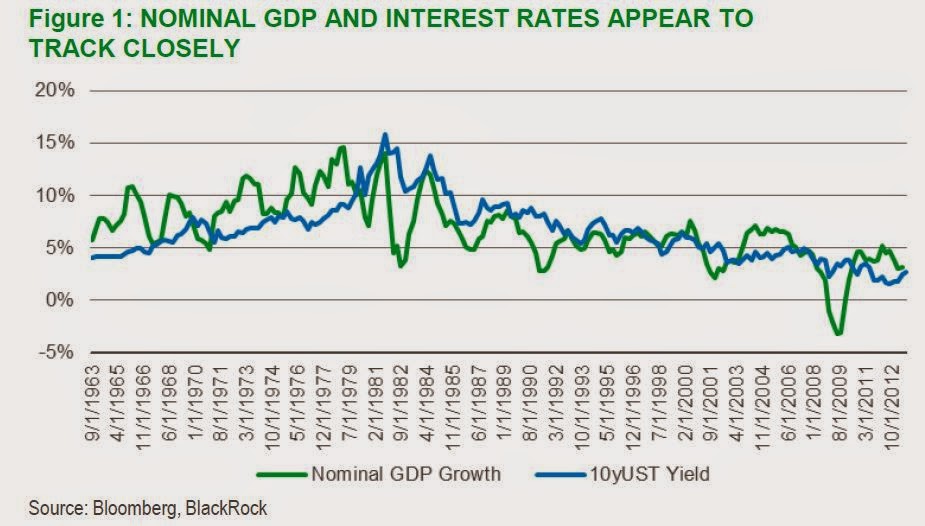
People have been calling for higher rates for years now, so I won’t quote anyone’s guess on where they think rates will go. Here’s a chart I used in a post a while back about valuing the stock market using interest rates. Since noone can predict interest rates, as a proxy, I used the nominal GDP growth rate as a level where long term interest rates should eventually settle.
Here’s the chart that only goes to 2012, but since it’s a long data series, it doesn’t matter too much:
Of course, the problem with this is that yes, nobody can predict interest rates but to use this model we need to predict GDP growth and inflation. Economist track records there aren’t much better.
But we can at least see where rates would be without the “distortion” of central banks given reasonable assumptions.
For example, I have no problem with “normal” long term real GDP growth of 2.0%, and inflation in the 2.0%-3.0% range. That gives us a range for nominal GDP growth of 4-5%. So interest rates too, should be around there. I have no problem thinking of 4-5% as the level of long term interest rates in a normalized environment with no central bank manipulation of long term rates (well, there will always be some sort of activity going on, but I just mean the massive QE-type thing).
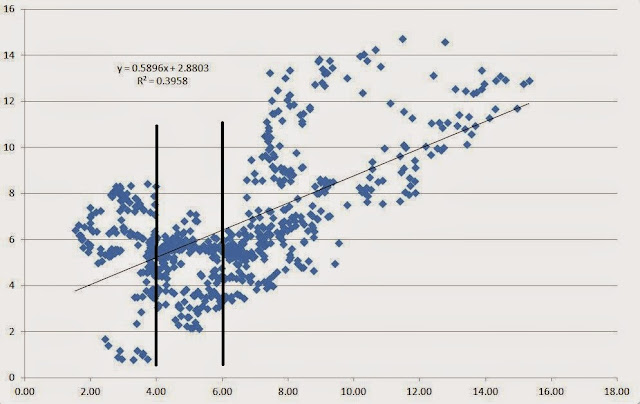
Let’s go back to the above X-Y plot charts. I am going to go back to the chart from 1955 to include more data. Data before 1955 may not be too meaningful, plus 59 years is enough data for this.
I drew vertical lines between 4% and 6%. My question is, what is the average earnings yield (and standard deviation) of the stock market when interest rates were in this range? Keep in mind that this interest range is far higher than where interest rates are now.
When interest rates were between 4% and 6% since 1955, the stock market traded at an average P/E of 20.4x. If you put standard deviation bands around the cluster, the range would be 16.6x – 26.6x for one standard deviation and 14x – 37.9x for two standard deviations.
If you expand the range to 4-7% or 4-8%, then the average P/E comes down to 14x, so in that case the market would look overvalued. But I think a lot of the vertical dot cluster in the 7-8% range is from the 1970’s. Of course, we can’t assume that won’t happen again.
Just for fun, let’s see these figures from 1980-2014. Some will argue that this is no good since the market has been overvalued for most of the past three decades. But again, let’s just see for fun:
Interest rate range average P/E
4 – 6% 23.3x
4 – 7% 22.7x
4 – 8% 21.6x
If you do it by constant range (instead of expanding it) you get:
Interest rate range average P/E
4 – 6% 23.3x
6 – 8% 19.6x
Using data since 1980, even if rates went up to the range of 6-8%, the market would be fairly valued at 19.6x P/E.
I actually don’t agree with this; I would still value the market at closer to the inverse of the bond yield; a 6-8% interest rate range would suggest P/E ratios of 13-17x.
Shorting an Overvalued Market?
So people keep saying the market is overvalued. If you are short the market because you think it’s overvalued, then you would have to think hard about it. The above suggests that the market is not overvalued even with interest rates going up to 6% (well, I would view it as a little overvalued with rates at 6%). If you think the market is overvalued, then you have to think that bond yields have to go higher than 6%. But then if that is the case, it’s probably a better trade to just short the bond market.
When you say the market is overvalued, you are basically saying that interest rates are too low. In that case, the bond market is even more overvalued than the stock market; the stock market has a big valuation cushion before rising rates start to hurt it whereas bond prices will get hit immediately. In fact, if you believe in mean regression, then you would have to actually buy stocks and short bonds against it.
Of course, there are other reasons to be short the market, but I am just isolating this one component, valuation.
If you look at long term charts of market valuation, it looks really high and scary, but the above shows that in this environment, things are pretty normal.
If you do assume that a 1970’s event is coming soon (and this view is not so uncommon), then shorting stocks and bonds might be a great idea. But even then, you have to keep in mind that if you do short expecting a 1970’s-type event, you are betting on an event that occurs very infrequently. How many interest rates spikes and inflationary events have we had in the past 100 years?
As Buffett likes to say, it’s not smart to bet on low probability events. (It’s just as dumb to assume that low probability events are zero probability events!)
Conclusion
I don’t know why, but I suddenly just wanted to do this. I guess Buffett’s comment made me think about market valuation again and made me wonder what “normal” interest rates are and where the market should trade in that case. Sometimes it’s fun to plot some data to see what things look like.
I am more comfortable comparing bond yields and earnings yields directly as Buffett does in his discussion about market valuation (which I excerpted in length here: Buffett on Market Valuation) without going through all of this.
From this, though, we can conclude that even if long term interest rates pop up into the 4-6% range, the stock market is still in the fair value range; the market is trading now at just about exactly the average level the market has traded at when interest rates were between 4% and 6% since 1955.
Yes, moving that range up to 7% or 8% moves the average down to a 14x P/E, but most of that vertical cluster is from the 1970’s (note the lack of that cluster since 1980). The same figures for data since 1980 shows much higher valuation levels (but maybe biased on the high side).
If we are constrained in growth as economies around the world mature, then normal interest rates may not go too far above the 4-6% range. If that’s the case, the stock market looks fine.


Buffett said "extremely cheap" if rates stay here.
Thanks for the comment, I had been feeling uneasy about the market's current valuation, but this is a good defense of it. I suspect higher interest rates (at least 4-6%) would mean reduced earnings and a pretty bad bond market that the market would have trouble digesting for a while. But longer term I think you're right.
Yeah, there will be some volatility, taper-tantrum etc… but over time if rates settle at around 4-6%, then current valuations wouldn't be a problem.
But then again, this is not a prediction or anything like that. I have no idea if the market will crash tommorow or if it will launch into a parabolic run or whatever; these are just observations given certain facts and data…
Can you post a graph showing the ratio of (bond yield : earnings yield) on Y-axis and the year on the X-axis? It would be interesting to see if the ratio has changed through the years.
Hmm… I just created the chart but don't know where to put it. I can't paste it here for some reason. If you google it, I think you can find it. Everyone looks at that so it's sort of all over the place.
You may not see P/E ratios compress if interest rates jump up, but you will definitely see earnings go down because of the higher debt service. I would guess 10-20%…. http://csimarket.com/Industry/industry_Financial_Strength_Ratios.php?sp5
Yeah, but that's a static, all-else-equal analysis (some will make more money, particularly banks). If rates go up on stronger economy and more inflation, there can be more pricing power too so you can have increasing revenues and better earnings too. Of course, this may not happen, I'm just saying…
You have to think of the S&P as a 10yr bond. You are merely clipping the earnings each year+ the growth in corporate profits. Assuming 6% on the 10yr, you are saying the S&P earning 5% + 4-5% (long term growth) is still cheap? I'll be switching to treasuries in a heart beat. At that point Treasuries become a cheap option on future opportunities (aka recessions).
On the other hand if rates stay where they are at for the next 10yrs then the S&P is really cheap when you discount the future cash flows. There's a huge difference in the NPV between discounting at 6% vs 1%.
I wouldn't call that cheap. I am just pointing out history. Most analysis these days just point to the high current valuation saying things are going to crash or whatever, but I just wanted to point out that even if rates moved up a lot from here, the market valuation is not out of line with history at all.
I have seen before the use of the inverse of interest rates to project sustainable PE's. I never understood the connection. Is there a mathematic reason that the two are related? Is it just an economic shorthand that works over a certain range? good article, thanks.
Hi,
Buffett talks about comparing earnings yield to bond yields in one of his annual reports that I excerpted extensively in the Buffett on Valuation post which is linked in the above post so go read that. That should give you an idea.
I read that and still don't get it. Kinda feel dumb now, but thought I would still ask. How is PE related to interest rate? Is there a link between them. I get that the earnings "yield" is the inverse of PE. I just don't understand how the earnings yield means anything. I mean, you don't get money from the stock unless it has a dividend yield and that is different from the earnings yield.
Forget for a moment that a P/E ratio is about stocks. Let's just say that you have a choice between owning a bond that promises to pay you 5%/year for the next 10 years (or whatever). And then you also have a business that you can buy that earns $50,000 per year. The opportunities would be equal if you could buy the business for $1,000,000. In each case, you would get $50,000/year if you invested $1,000,000.
So that's why they are related.
The reality is not so simple. Earnings often doens't equal free cash, for example. But in aggregate, earnings tend to be a good proxy for it, and over time as in the charts above, earnings yield and bond yields have been related closely.
I can't really help you any more than that…
Oh, and if you are stuck on dividends versus earnings, theoretically, it doesn't matter too much. If management reinvests what's not paid out in dividends, then the shareholder is sort of still earned the EPS; it's just that part of it was paid out as dividends and the rest of it was reinvested. In either case, the earnings still belong to shareholders.
Of course, if management makes bad investments, then that may not be true. But again, over time, if you look at the aggregates, I do think that reinvested earnings do increase value to shareholders (even though the returns on investment may or may not be good).
Anyway, I would suggest reading the Benjamin Graham books (Intelligent Investor, Securities Analysis) if you still don't understand…
You probably know this but Cliff Asness wrote an excellent paper on the Fed model: http://papers.ssrn.com/sol3/papers.cfm?abstract_id=381480
The conclusion is pretty interesting (can't copy it), but the whole abstract is well worth reading!
Hi,
I'm not surprised; he's a quant so he should be all over things like this. I read the summary and none of it surprises me, really. Look at the data above and see how scattered it is. He makes some good points too.
The difference is that I am not trying to predict anything. Asness' primary reason for being is to be able to predict things. I can see how earnings yield/bond yield would be totally useless as a timing device. Also, of course the raw, absolute earnings yield is more predictive of future returns than a bond yield / earnings yield measurement, just as a bond's coupon is the best predictor of future performance on the bond (assuming investment grade).
He raises a good point about nominal and real coupons too, which benefits stocks (as earnings will rise with inflation whereas bonds won't).
So it doesn't really matter to me. I am not looking for accurate predictions or a timing device when looking at things like the above. For me, just historical facts such as, "when rates are in the 4-6% range, stocks tend to trade at 20x P/E" is useful, but it doesn't really change my behavior with regards to anything. I'm not going to switch back and forth between stocks and bonds based on it (unless things go really out of whack, then I might!).
Anyway, I don't spend much time on this sort of thing, but I'll read Asness' paper. I haven't read anything like this in a while so it might be fun, and if I have anything to add, I'll come back and make a comment.
Thanks for posting the link.
OK, so I read the whole paper. He makes some good points, like the DDM; if you lower interest rates, then you have to lower growth rates too as some of the growth comes from inflation. If rates are lower (and inflation expectations are lower), then prospective growth rate should be lowered too (to reflect lower inflation). So things like that make sense and he is right. However, others would argue that growth rates are based on ROE x earnings retention, and ROE has been in a constant range for a long time regardless of inflation. But I don't want to argue about this stuff; I don't spend much time on it.
As for the conclusion, it's a bit strange. He acknowledges that PE and bond yields trade together. On a risk-adjusted basis, that relationship has held for more than 100 years. But he claims the market is wrong in doing so. This may be true. Again, I don't waste time arguing who is right or wrong. If something holds true for 100 years, I'm fine with using that as an indicator of some sort. I'm not going to jump up and down and say people have been wrong for 100 years. Of course, that's possible. But I don't really care.
His main claim is that the bond yield earnings yield (fed model) fails to predict future market returns, and raw P/E is better at doing so. I totally agree with that too. The lower the P/E, the higher the future return. Duh. I wouldn't use the Fed model to predict future returns, so he is sort of proving something that nobody is really claiming (to my knowledge).
And finally, (and the reason I ignore economists and academics), he wrote this paper in 2002 and said the market is overvalued at 24x p/e versus a historical 14x average and said the fed model proponents are wrong claiming the market is fair thanks to lower interest rates. He even said that the market (in 2002) was 2x – 3x higher than it should be.
Well, the market is up 9.5%/year since 2002.
As Buffett said, if you have one economist in your company, you have one employee too many.
Oh, and he said the Fed model proponents are confused because they compare real (earnings yield) versus nominal (bond yields). Earnings yields are "real" because earnings are expected to grow with inflation whereas bond coupons do not. Well, this is true too, but I don't care because that only works in favor of stocks. If bond yields are 5% and earnings yield is 5%, then in reality, stocks are even more interesting because real bond yields might only be 2-3% versus the 'real' earnings yield of 5%.
Of course, with inflation (if it goes higher), we have problems of depreciation being too low and earnings reported too high and higher capex to replace equipment etc…
Anyway, this discussion is sort of interesting but really academic and not relevant to most stock-picking value investors, I don't think…
Thanks for posting the link, though.
If interest rates rise, the earnings will fall. Also everybody goes from stocks to bonds. With the higher interest rates the companies have to pay more for the debt and they have less income because of the inflation. This plus the selling market will cut the stock market by 40 to 50 percent.
I too was worried about the market valuation until Friday when Buffett's 13-F came out. For the first time in at least 2 years, Buffett added to his already massive bank positions:
http://investingden.com/showInv?cik=0001067983
Buffett already had more than half his portfolio in WFC +USB + BAC (I am sure he will buy the 700m BAC shares because he had been buying BAC on his own in 2008 until it bought Merrill Lynch, also he took a tiny 6% interest rate from BAC when he lent them the money). Why would Buffett buy another $500 million worth of WFC and USB for the first time in two years in Q1 2015. He already had $31 billion worth of WFC + USB before his Q1 purchases. Add another $11.5 billion for BAC and it comes to more than half his portfolio.
Buffett has never bought a single concept so heavily ever in his career, it could only be that he thinks the yield curve will widen. His banks have had depressed net interest margins and flat loan growth for a long time. Because Buffett can't be wrong, I think the yield curve would widen. A steeper yield curve would have to be positive for the economy overall due to increased lending by banks like WFC, BAC, USB.
Stocks are long duration assets – so I think at the very least – you need to add some term structure premium (use a 50yr bond or a 100 yr bond!) when doing the Fed model type analysis.
Secondly, rather than using risk free rates, use BBB at the very least – since stocks are lower down the capital structure and hence need to "yield" higher.
Of course, what offsets this is the assumed growth rate (which stocks enjoy, and bonds don't).
Good point. I've seen many variations of this over the years but the total picture looks more or less the same. You can use longer term bonds but it won't make much difference, I don't think. Same with credit spreads; over time they average out to some constant percentage over treasuries etc. It might make a better fit, though, in some time periods when the market/economy was weak (and credit spreads blow out) I suppose. But we aren't looking for an accurate model or anything; just wanted to see what would happen if treasury rates went up.
The statement that stocks are not overvalued by historical standards hinges on the fact that historically high operating margins will be sustainable. History has clearly shown us that these margins tend to be mean-reverting, hence the normalized EY – interest rate spread is lower than the actual spread (besides there is also a high probability that interest rates are below its normalized levels). Since stocks are forward looking, it wouldn't suprise me if the stock market would already dip sooner or later, in anticipation of lower margins.
I really enjoyed this blog post. It's nice to have someone relate stock market's valuation to our current interest rate environment in a clear, thoughtful way.
I was wondering if you could give your thoughts on additional reading (books, articles, etc.) on this topic that you could recommend or point to? Also, if I wanted to reproduce this analysis could you include a footnote with links to your data sources?
Thanks again!
Hmm…. further reading on this topic? I can't think of anything off the top of my head. It's just a simple comparision of interest rates versus earnings yields.
As for the source of the raw data, it all comes from Shiller's website so you can google Shiller P/E or something like that.
Thank you so much for your excellent blog! I really enjoy to visit your very interesting post, Well done!
Bankruptcy Lawyers Near Me
Divorce Without Separation Agreement