Shiller said the other day that the market can go up 50% from here. OK, so I fell for it and clicked to watch the CNBC video. This was sort of a surprising comment coming from the creator of the CAPE ratio, one of the main indicators bears use to argue that the market is way overvalued.
Of course, this is not Shiller’s forecast or expectation. In fact, he says that this is very unlikely, but it is possible. His point was simply that the CAPE ratio is 30x now, and in the 1990’s it went up to 45x. So if that happened again, that’s a 50% increase.
This is totally possible, especially now. I would not invest in the market with that expectation, of course. Actually, I would invest with the opposite expectation (when pressed, Shiller said the market is more likely to go up 50% than down 50%).
Trailing P/E
Let’s put the CAPE aside for now and just look at regular trailing P/E’s. Back in 1999, that went up to 30x, and in 1987, it went up to 21.4x (this is from the Shiller spreadsheet).
We keep hearing from the bears that the market is as expensive as it was during previous peaks, so we are in dangerous territory; they say we are in a bubble.
OK. That is possible.
But in previous posts, I argued that if 10 year rates stabilize at 4% over time (it’s at 2.3% now), it is possible that the market P/E can average 25x during that period. Maybe the market fluctuates around that average, so the market can easily trade between 18x and 33x P/E without anything being out of whack. (Buffett also said at the recent annual meeting that if rates stay around this area, then the stock market could prove to be very undervalued at current levels.)
So we have a problem. This 18-33x P/E range puts the market in bubble territory according to the bubble experts. But we are saying here that if rates stay at 4%, that’s the normal range the market should trade at.
So then, how can we tell when we are in bubble territory?
Since we are using interest rates to value the stock market, we will have to interest rate adjust our bubble levels too.
Interest Rate Adjusted Bubble P/E
So just looking back at 1999 and 1987, here are the indicators at the time:
PE EY 10yr
1987 21.4x 4.7% 8.8%
1999 30.0x, 3.3% 6.3%
Both 1987 and 1999 had the feel of a rubber band stretching and then snapping. You will see that the earnings yield was 4.1% lower than the 10 year rate in 1987 and 3% lower in 1999.
Right now, the P/E ratio is 23.4x, for an earnings yield of 4.3% versus the 10-year rate of 2.3%. So it’s a full 2.0% higher, not lower. But even I think 2.3% on the 10 year is too low. I use 4.0% these days for what I think is a non-bubbled up, unmanipulated-by-the-Fed, sustainable, normalized rate.
Using this spread, long term rates would have to go up to 7-8% for me to worry about an overstretched rubber band snapping.
How about the stock market? How high would it have to go before I think we are really in bubble territory?
With interest rates at 2.3%, we can’t deduct 3% or 4% from it to get a bubble-level earnings yield.
So we’ll look at it as a ratio. In 1987, earnings yield got to as low as 0.53x the bond rate (4.7%/8.8%) and in 1999 it got to 0.52x (3.3%/6.3%)
Using the current 2.3% 10-year rate, earnings yield would have to get to 1.2% for me to really think that maybe we are in a stock market bubble. That comes to 83x P/E! At that level, trust me, even I won’t be talking much about long term investing, and would probably be net short with a bunch of put options too.
But wait, let’s not use 2.3% because we all know that’s too low. Let’s use my normalized 4%. Even with a 4% bond yield, earnings yield would have to get to 2% to be considered really bubble level. That is a P/E ratio of 50x. That’s more than a double from here.
So for me, the market would have to actually more than double from here before I see it as really bubbly. (If you want to see what a real bubble is like, look at Bitcoin!)
Narrow Market
The other thing I hear a lot is that the market is up only because of the very few hot tech stocks like the FANG stocks. They make it sound like the market would be doing nothing without them. Maybe.
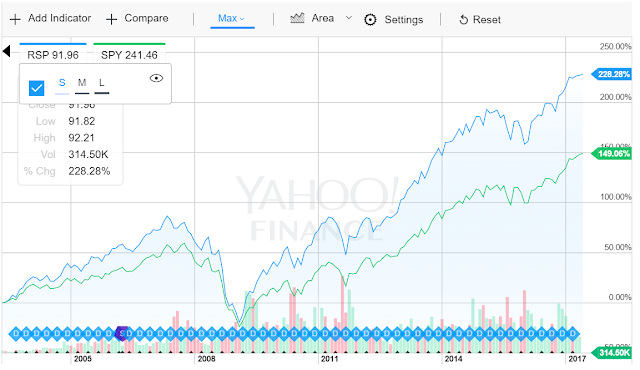
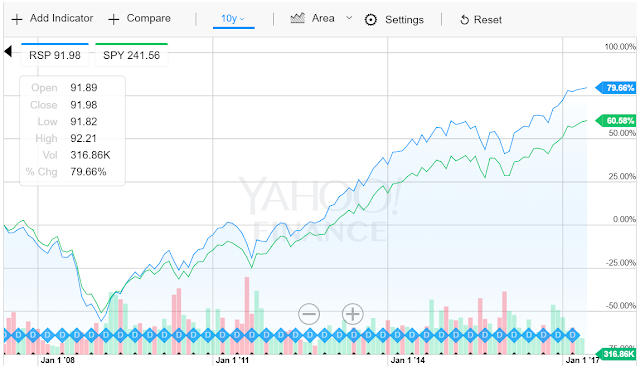
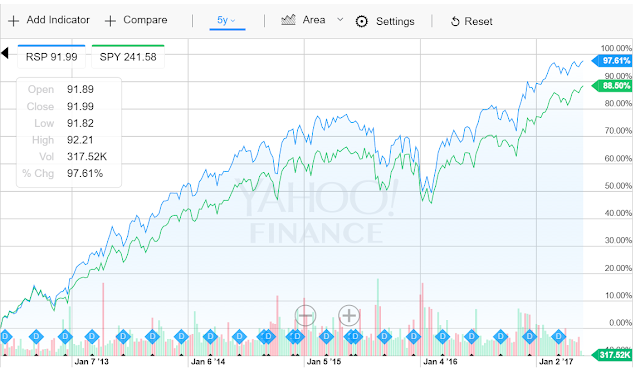
But just as a quick check, I compared the S&P 500 index (ETF: SPY) to the S&P 500 equal-weighted index (ETF: RSP); the super-large caps would have no more impact than the smallest S&P 500 companies.
Check this out:
(The blue line is the RSP, green is SPY)
In all of the above time periods, the RSP outperforms SPY, which I don’t think would be the case if it was only a few of the super-large caps that is pulling the S&P 500 index up.
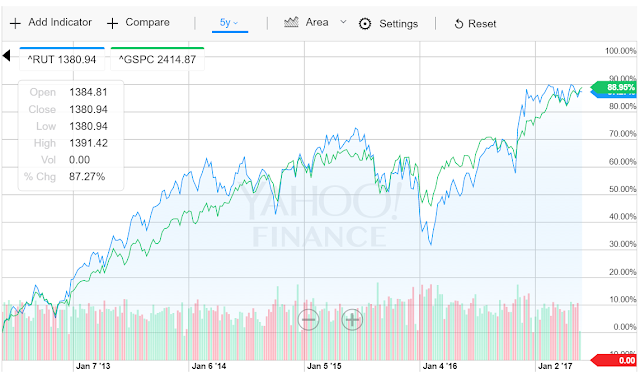
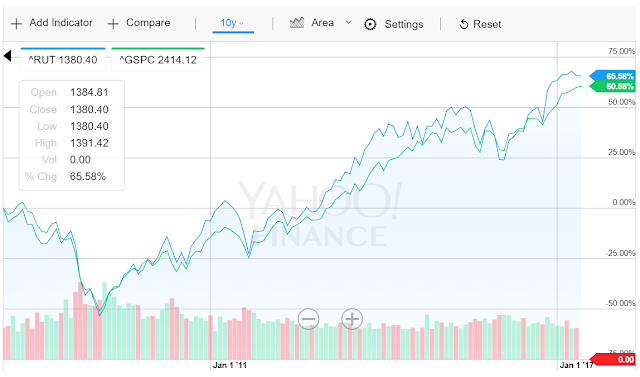
Just for fun, I looked at the S&P 500 index versus the Russell 2000 index too. If only a few super-large caps were pulling up the averages, then obviously, the S&P 500 index should be outperforming the Russell 2000 too. The blue line is the Russell 2000, and the green line is the S&P 500 index.
Here too, I don’t see the S&P 500 outperforming in a big way lead by the supers. To the contrary, the S&P 500 index is behind the Russell in the 10 year period.
I had no idea what I would see when I put up these comparisons. Looking at them now, I am a little disappointed in active managers who claim that they are underperforming because they don’t own the FANG stocks; the above shows that maybe that’s not the issue.
Anyway, that’s another ongoing topic here.
Conclusion
All of this stuff, I just do sometimes to satisfy my own curiosity; not to make any claims either way. I have no idea what the market will do, but I don’t believe we are in a stock market bubble at all. OK, if interest rates got up to 7-8% and valuations are still here in the 23-24x P/E area (trailing basis), then yes, I would agree we have a valuation problem.
Otherwise, it would take a market P/E of 50-80x for me to think we are in a stock market bubble (and I would put on shorts and load up on puts! But even then, I wouldn’t expect an immediate payoff. If the market took off like that, it would be very hard to pick the top).
Otherwise, we are just, in terms of stock market valuation, in the “zone of reasonableness”, to borrow Buffett’s phrase from a few years ago.
Also, keep in mind, this 50-80x P/E ratio range is not a target, of course. That’s where it has to go before you convince me we are in a stock market bubble.
Also, this doesn’t mean the market can’t enter a bear market at any time. There was no interest rate / earnings yield rubber band in 1929 and 2007.


Thank you for posting. Can you help explain to me why interest rates would affect the market PE so much? I understand how interest rates may affect the PE for certain companies, but why is it used to adjust the PE of the entire market?
In general, asset prices are determined by interest rates as the value of assets are the sum of all future cash flows they are expected to generate. If interest rates are lower, discount rate is lower, so asset prices are higher. There has been discussion/debate about that here in previous posts about market valuation. But the general gist is that lower interest rates => higher asset prices, and P/E ratio is a common yardstick of stock prices.
http://www.philosophicaleconomics.com/2017/04/diversification-adaptation-and-stock-market-valuation/
has a new post that touches on your question and this topic. the author does a good job I think of explaining theoretically the risks involved in certain securities and how they affect the pricing of the security. the author also provides a pretty persuasive argument as to why the ease and low cost of diversification could lead to a systematically higher pricing of equities.
Great blog post. I believe Buffett in the past has also mentioned 2 other important variables. Economic growth and the % of economic growth that is captured or derived from the Corporate sector. I am no economist but I would guess one couldn't expect below average interest rates and above average growth to be sustained for very long. I guess low economic growth is possible and the corporate sector continues to gain a higher and higher % of that growth, but the current levels look pretty high vs. history. The appealing thing of a PE or Shiller PE is that in theory, that metric captures all 3 of these variables. How would you think about including these components in the current environment? I believe Buffett wrote an article/speech in 1999/2000 and gave his estimates of each of these variables. He was right that the market was too high but for the wrong reasons. He thought interest rates at the time couldn't go much lower than 4%. Thanks for your blog. I really enjoy it.
Hi, good points. The model Buffett used in 1999/2000 was the same one he used back in 1969, I think. He said something to the effect that stock market returns is basically dividend yields plus real GDP growth plus inflation. That's also where I get my 5-6% equity market expected return (2% dividend yield + 2% real GDP growth + 2% inflation; others will argue that including share repurchases would make 'real' dividend yield more like 3-4%).
As for share of profits to GDP, I don't know really how to parse that as the S&P companies get 40-50% of sales and/or profits from outside the U.S. If Kraft-Heinze bought Unilever, it would boost that ratio but not really change the market valuation, right? Google, Apple and many others make tons of money outside the U.S., so comparing corporate profits to GDP doesn't make too much sense to me.
As for CAPE and other things, Buffett did say at the recent annual meeting that people always try to simpilify things to a single model, ratio or indicator, and that things are not so simple.
Thanks for dropping by…
Great post! Thanks for doing this. I won´t mention his name, but someone well know just commented about the frothiness of the mkt and the ¨distortions¨ caused by quant trading in large cap tech names. This post seems to make a good argument against that theory.
Great comparison with 1987 and 1999 earnings yields, really helpful! But I'm not sure you can draw any meaningful conclusions from comparing SPY to RSP, over time you would expect any equal-weighted indexes to outperform the value-weighted versions:
https://greenbackd.com/2012/05/17/why-does-an-equal-weighted-portfolio-outperform-market-capitalization-and-price-weighted-portfolios/
Thanks for sharing the informative blogs with us on trading. Keep updating more like this.
Hey, thank you for this analysis. Just out of curiosity, why did you not include 2007? July 2007 P/E was around 20x, implied EY is 5% and July 10yr yield was 5.1%. So spread of 0.1% and EY/PE ratio of 1x. If one was to include this in the numbers the average EY/PE ratio would be 0.7x so using you 4% normalised interest rate that would return a 2.8% EU for the market or a 36x PE ratio vs the current 25x (rolling, not CAPE). So even including 2007 agree that we are not in bubble or rubber band scenario yet but maybe closer that suggested above? What do you think? Thank you!
Hi, I think I was only looking at big stock market bubbles, and 2007 wasn't really a stock market bubble. For example, there was no parabolic explosion to the upside etc.
As for taking averages, I have other posts that actually look at the EY/PE including all data going back and I don't think there is any rubber band stretching at all.
Thanks for stopping by.
Hey, thanks for the quick reply. Agreed re 2007 not being typical equity bubble (but credit bubble) so probably fine to exclude from the analysis. Think question is when the next downturn will hit? US corporate debt level are back to pre recession levels so with rising interest rates this will over time put some corporates into problems. Personal income growth is slowing a bit but banks are healthier than in 2007 as well as less speculative home building happening. But hard to predict of course in the absence of a crystal ball…